ctiSVR 1.5.0 just released, this version has the following updates:
1. Add uint32 header before send / receive for the xml api.
2. The server is only compatible with calltoui64.exe 1.5.5.0 or above.
3. New commands “add apiuser”, “delete apiuser” and “disp apiuser” to add / delete / display apiuser.
4. Fixed reconnect api without data when the second call appearance is the connected call.
5. Able to set working directory for the linux version.
6. Able to override the telnet port.
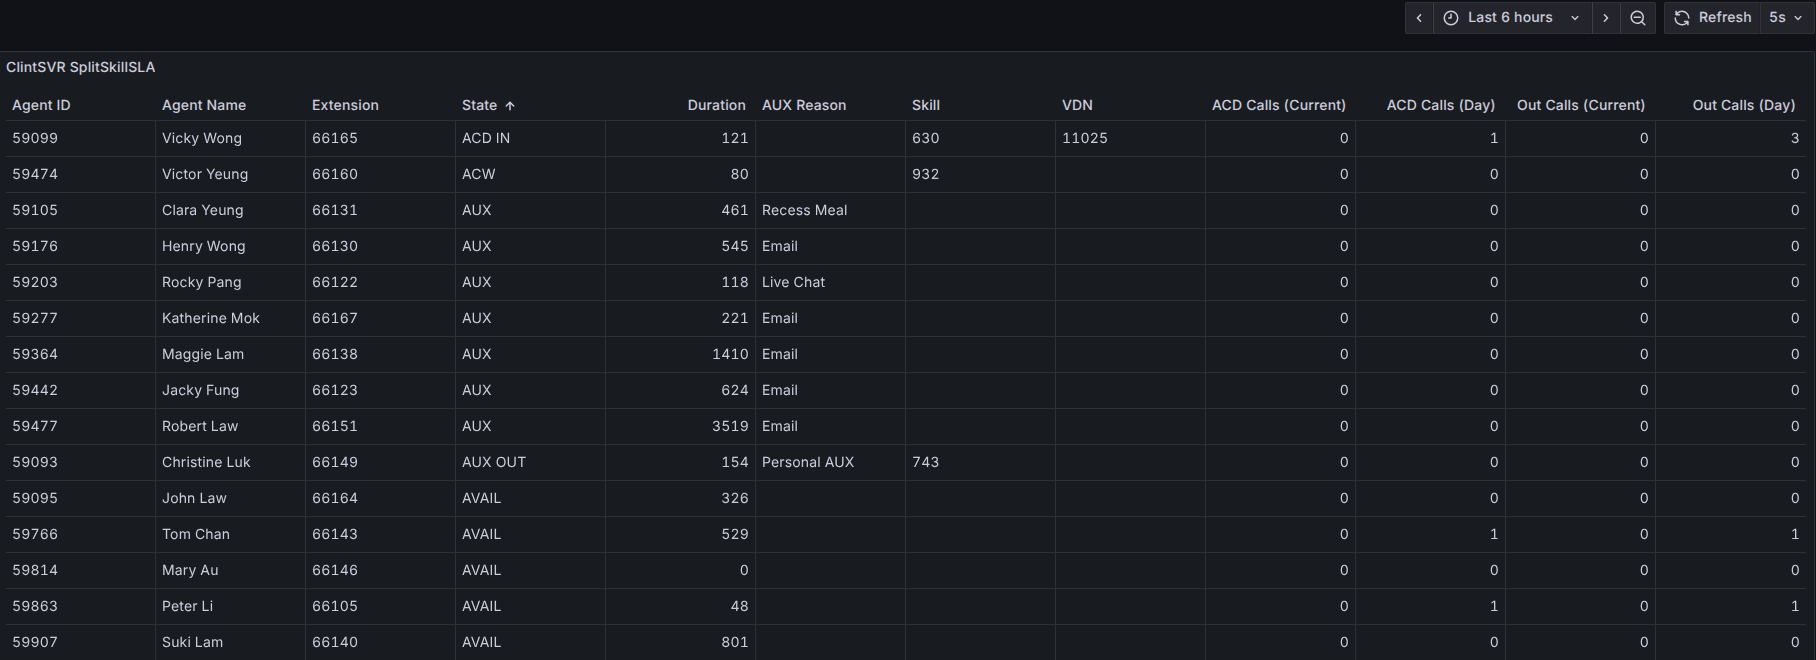
7. Support NATS and connects to NATS servers for message publish and subscribe functions. The first usage is calllogs are sent to callanalytics and NATS together. More data items are included in the callogs such as source of the sender, agent state and AUX reason code.

8. Add a new api called deviceagentstatus to get a list of agent status from a list of provided extensions.
9. Prepare to support RESTFul interface with POST method, the API functions makecall, consultation, reconnect, transfer, conference, userdata, makephantomcall, makecallbackcall, makeoutboundcall and pinver will be supported in 1.5.1.
10. Fixed outgoing call failed when uuiSVR is not available and the UUI data length exceeded certain CM limit.