Introduction
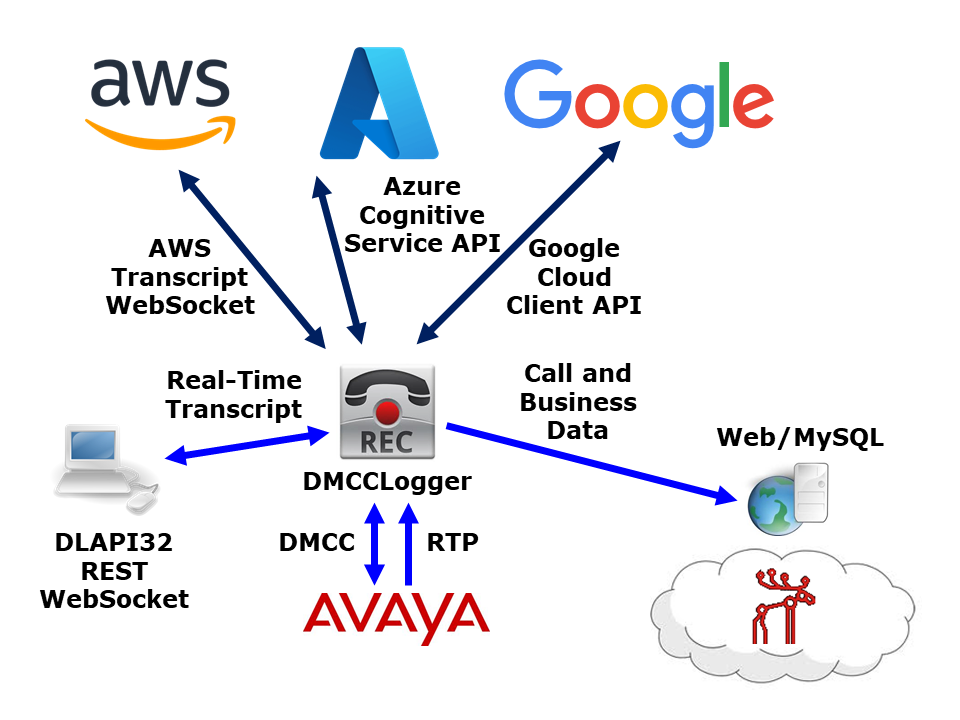
Call Analytics tool is a server program that monitors Avaya VDNs, ACD Hunt Groups and Extension objects, it extracts useful information from monitoring events and outputs call and agent records for applications such as reporting, wallboard integration and call log analysis. The Call Analytics tool is a CTI reporting and real time monitoring engine and it is an ideal tool when CMS is not in placed for call center environment.
The Call Analytics tool uses Avaya TSAPI library, it monitors these Avaya objects and produces the data for real time reports, splunk and database logging. Also, the data can be accessed by various interfaces such as API DLL, database and REST interface. The Call Analytics tool is useful in the following areas:
- To detect nuisance call attacks by monitoring abandon calls and short duration calls
- To detect fraud activities such as KPI manipulation which caused by agent short duraton calls
- To identify the callers of the abandon and short duration calls
- To capture user data from TSAPI UUI and store the user data together with the call data in Splunk and database
- To provide real time data for building of real time reports and dashboards
- To trace a call from its beginning to end, multiple call records can be correlated by common key such as UCID
- To list customers waiting in queue together with their calling number and waiting time
- To find out how long each customer waits for an agent
- To find out the frequency and duration of an agent to perform hold call
- To find out agent or customer who hangups a call first
- Uses the VDN detail call logging which stored in the database for different kind of reports
- Uses the abandon and short duration data for different kind of CRM application
- Passing Data between Avaya and Asterisk
See Also: clintSVR / CMS Real Time Data
See Also: bcmsSVR/BCMS Real Time and Historical Report Data
See Also: CallAnalyticsLight
See Also: Splunk App CallAnalytics
See Also: Passing CTI Data between Avaya and Asterisk
Testing using Docker Image
Please follow this guide to test CallAnalytics using Docker Container.
Testing using OVA File

We also create a OVA file which you can deploy it to VirtualBox or VMware for testing. After deploying the OVA file, please modify the following for your own environment:
- Reference this guide to delete the file /etc/udev/rules.d/70-persistent-net.rules
- Change the MAC address and IP address of the VM in the file /etc/sysconfig/network-scripts/ifcfg-eth0
- Edit /usr/lib/tslibrc, change 127.0.0.1 to the IP address of your Avaya AES
- Telnet to CallAnalytics console port 14003, update the parameters ca_tlink_01 and ca_tlink_02. The ca_tlink_01 and ca_tlink_02 string contain three fields and they are separated by comma (,). For example “AVAYA#AVAYA_ECS#CSTA#XXXXXX,username,encrypted_password”
- AVAYA#AVAYA_ECS#CSTA#XXXXXX is the tlink, you can get the name by command /usr/lib/tstest
- username is the AES cti user
- encrypted_password can be obtained by tcpgate console command genpass, enter your AES cti user password two times you will get the encrypted password
- Once the changes are completed, reboot the VM
- Contact service@upinget.com for a trial license
The username and password of the OVA VM is
- OS : root/P@ssw0rd
- MySQL: root/P@ssw0rd
- ivrSVR console: tcpgate/tcpgate01
- uuiSVR console: tcpgate/tcpgate01
Preparation and Password Encryption
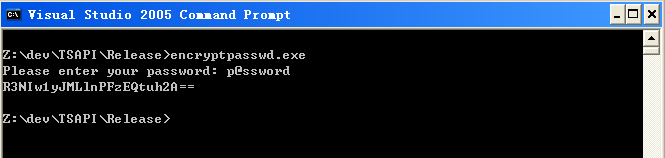
- The access MDB file stored the username and password of AE server. For security reason, a tool called encryptpasswd.exe is provided to generate an encrypted password for the installation and configuration of the software in Windows environment
- Execute the program, generate an encrypted password for the AE server CTI user, then paste the encrypted password to parameter ca_tlink01 or ca_tlink02. For example, the encrypted password for “p@ssword” is “R3NIw1yJMLlnPFzEQtuh2A==”

64 bit Windows System
- For 64 bit Windows system, please follow the steps below
- Configure ODBC System DSN using
- C:\Windows\SysWOW64\odbcad32.exe
- Configure ODBC System DSN using
- If your system does not have the 64bit version of Access driver, please download and install Microsoft Access Database Engine 2016 Redistributable.
Windows Installation
- Download the TSAPI client for Windows 32-bit from Avaya web site, it contains the TSAPI library files. DevConnect registration is required before you can access the download page. Download the TSAPI client for Windows 64-bit if you install the 64bit version.
- Download the Call Analytics Tool zip file here.
- Follow the installation steps below to install the software.
- Extract all the files into directory c:\program files\callanalytics
- Open Windows Command Prompt, enter the following commands to register the program as Windows Service.
- cd c:\program files\callanalytics
- callanalytics -i
- sc description callanalytics “Provides call analytics functions for Avaya CM”
- Open ODBC Setting, create System DSN called CALLANALYTICSCFG for Microsoft Access Driver and point to callanalytics.mdb which is located in the directory c:\program files\callanalytics
- To manually configure the parametes, please follows these steps
- Open the Access file, edit the value of parameters ca_tlink_01 and ca_tlink_02 to the TLINK of your AES servers in the tParameter table.
- Edit the value of parameter ca_movingavgmin to define the moving average period for the calculation of abandon and short duration call rate. The default value is 15 minutes.
- Edit the value of parameter ca_intervalstatmin to define the interval statistics period for the calculation of abandon and short duration call rate. The default value is 30 minutes.
- Edit the value of parameter ca_shortduration to define the number of seconds for short duration calls. The default value is 3 seconds.
- Edit the value of parameter ca_agentstatechecksplit to true when you want to poll agent state of agents that login to split, the default value is true
- Edit the value of parameter ca_agentstaterefreshrate to the number of seconds for each polling, the default value is 15 seconds, the minimum value is 5 seconds.
- Edit the value of parameter ca_cache_timeout to define the number of seconds as cache time for real time reports. This setting reduce the AES loading when multiple clients retrieve the same report during the cache period.
- Edit the value of parameters ca_splunkhost and ca_splunkport with IP address of Splunk and port number for TCP data input.
- Start the Windows Service callanalytics
- Telnet to localhost and port number 14003, enter username tcpgate and password tcpgate01 to access the program console.
- Enter the following command to setup the program parameters
- setup
- setup database
- setup apai
- Enter the following command in the program console, you will receive information when there is call abandon and short duration call.
- trace on asc
- Enter the following command to add your VDN
- add vdn xxxxx
- Enter the following command to add your ACD
- add acd xxxxx
- Enter the following command to add your Extension
- add extension xxxxx
- Enter the following command to display help message
- help
- After installation, we can use Splunk to implement real time and historical reports. These reports can be viewed as Splunk Dashboards. Also we can use to send Alert when certain predefined condition is occurred. The following is description is for each of the scenario and the Splunk search command and Visualization are provided for your easy reference.
RedHat/CentOS 7.x Installation Guide

- The following is for RedHat/CentOS 7 (64 bit only), other Linux distributions are not supported
- Avaya provides only 32bit version of TSAPI SDK, the CallAnalytics executable is also a 32bit application
- Login as root and execute the following commands
-
yum update -
reboot - Install the MySQL 8.x
-
sudo rpm -Uvh https://dev.mysql.com/get/mysql80-community-release-el7-1.noarch.rpm sudo yum --enablerepo=mysql80-community install mysql-community-server sudo service mysqld start grep "A temporary password" /var/log/mysqld.log mysql_secure_installation - Install the following packages
-
yum install glibc.i686 libstdc++.i686 expat.i686 unixODBC.i686 openssl-libs.i686 telnet wget telnet -
wget https://dev.mysql.com/get/Downloads/Connector-ODBC/8.0/mysql-connector-odbc-setup-8.0.22-1.el7.i686.rpm wget https://dev.mysql.com/get/Downloads/Connector-ODBC/8.0/mysql-connector-odbc-8.0.22-1.el7.i686.rpm yum install mysql-connector-odbc* ln -s /usr/lib/libmyodbc8a.so /usr/lib/libmyodbc5.so - Download Avaya Aura AE Services 8.1.3 TSAPI Client for RHEL 7 from DevConnect
- chmod +x tsapi-client-linux-8.1.3-25.i386.bin
- Execute the installation file tsapi-client-linux-8.1.3-25.i386.bin
- ./tsapi-client-linux-8.1.3-25.i386.bin
- Edit /usr/lib/tslibrc, change 127.0.0.1 to the IP address of your Avaya AES
- Config and start MySQL
-
chkconfig mysqld on -
service mysqld start - Create database and user
-
mysql -u root -p -
create database callanalyticscfg; -
create database callanalytics; -
create user 'tcpgate'@'localhost' identified by 'P@ssw0rd'; -
grant all on callanalyticscfg.* to 'tcpgate'@'localhost'; -
grant all on callanalytics.* to 'tcpgate'@'localhost'; -
flush privileges; -
quit -
mysql -h localhost -u tcpgate -p callanalyticscfg < callanalyticscfg.sql -
mysql -h localhost -u tcpgate -p callanalytics < callanalytics_MYSQL.sql - Copy the following to /etc/odbc.ini file
- [CALLANALYTICSCFG]
Description = MySQL connection to callAnalytics
Driver = MySQL
Server = localhost
Port = 3306
Database = callanalyticscfg - [CALLANALYTICSDBCFG]
Description = MySQL connection to callAnalytics
Driver = MySQL
Server = localhost
Port = 3306
Database = callanalytics
- [CALLANALYTICSCFG]
- Create user and copy files
-
useradd upinget -
mkdir /usr/local/upinget -
cp CallAnalytics /usr/local/upinget -
chmod +x /usr/local/upinget/CallAnalytics
-
chown -R upinget.upinget /usr/local/upinget -
mkdir -p /var/log/callanalytics -
chown -R upinget.upinget /var/log/callanalytics - Auto start the daemon after server reboot
-
echo "rm /tmp/callanalytics.log" >> /etc/rc.local -
echo "su upinget -c '/usr/local/upinget/CallAnalytics -u tcpgate -p 40UIt9O3PqtwsSn+Wx6pig=='" >> /etc/rc.local -
chmod +x /etc/rc.local
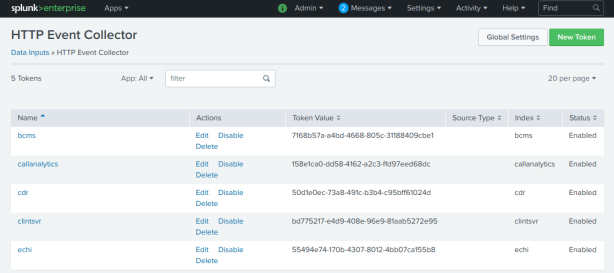
Splunk Integration using HTTP Event Collector
- Follow this guide to enable HTTP Event Collector in Splunk
- Create a token specific for Call Analytics application, copy the token after its creation, it is suggested to create a token for each specific application and link the token to it’s index
- Update the parameter ca_splunkhectoken using the newly created token
- update parameter ca_splunkhectoken new_created_token
- Update the parameter ca_splunkhecurl using your site specific Splunk url
- update parameter ca_splunkhecurl https://input-SPLUNKCLOUDHOST:PORT/services/collector
- Hint: Reference this guide to find out the Splunk HEC url
- Update the parameter ca_splunkprotocol to use HTTP Event Collector
- update parameter ca_splunkprotocol hec
- Update the parameter ca_splunkhecchannel using the newly create token
- update parameter ca_splunkhecchannel new_created_token
- Update the parameter ca_splunkdataformat to use JSON format
- update parameter ca_splunkdataformat json
- Reload the configuration
- reload
- If insert to Splunk failure, the data will be written to a local file called splunk_err.txt. You can upload the data to Splunk manually using curl command
- curl -k https://input-SPLNKCLOUDHOST:8088/services/collector/event -H “Authorization: Splunk token_generated_from_Splunk” -H “X-Splunk-Request-Channel: token_generated_from_Splunk” -H “Content-Type: application/json” –-data-binary “@splunk_err.txt”
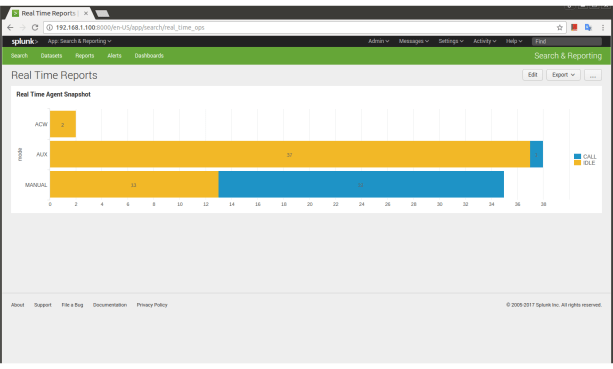
Real Time Agent Snapshot
- You need to add a report agent to execute agent snapshot report in order to generate the data to Splunk, the command to add this report in tcpgate console is
- add agentsnapshot all 15 agent_snapshot_every_15s
- Hint: Execute agent snapshot report every 15 seconds
- To snapshot the current status of each agent, the Splunk command is
-
index=callanalytics logtype=agentsnapshot [search index=callanalytics logtype=agentsnapshot progress=end | head 1 | fields + timestamp] progress=start | chart count by mode, talkstate - The Splunk Visualization is

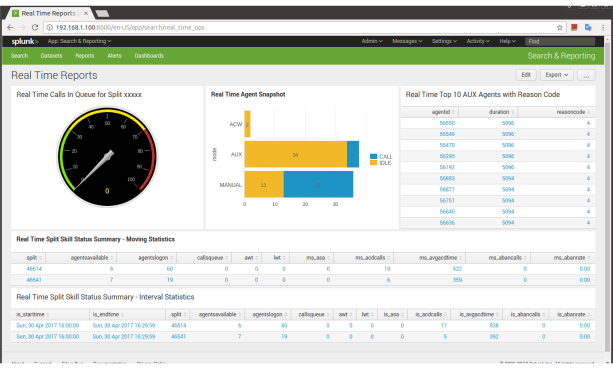
- We can add the report to Spunk Dashboard with refresh rate 15 seconds, the final result is
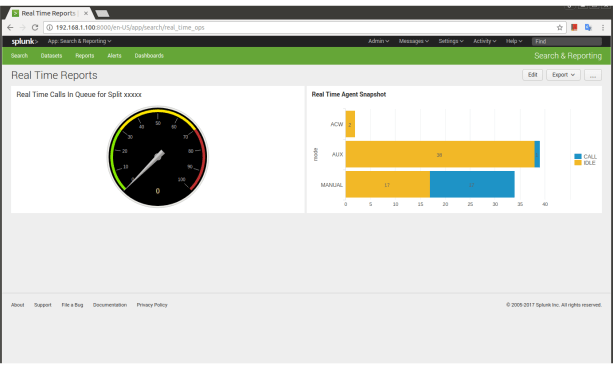
Real Time Calls in Queue for Specific Split
- You need to add a report agent to execute the SplitSkillStatus report in order to generate data to Splunk, the command to add this report in tcpgate console is
- add splitskillstatus xxxxx 15 SplitSkillStatus_15s
- Hint: Execute SplitSkillStatus report every 15 seconds
- To find calls in queue for a specific split, the Splunk command is
-
index=callanalytics logtype=splitskillstatus split=xxxxx | head 1 | stats values(callsqueue) as CallQueued - Replace the xxxxx with the specific split, the Splunk Visualization is

- We can add the report to Spunk Dashboard with refresh rate 15 seconds, the final result is
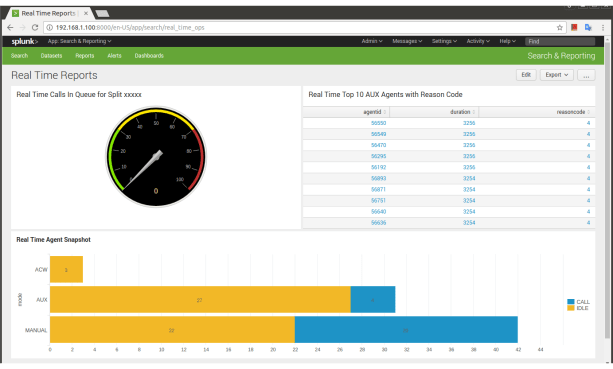
Real Time Top 10 AUX Agents with Reason Code
- To find out the top 10 AUX agents with longest duration, the Splunk command is
-
index=callanalytics logtype=agentsnapshot [search index=callanalytics logtype=agentsnapshot progress=end | head 1 | fields + timestamp] progress=start mode=AUX | table agentid, duration, reasoncode | sort - duration limit=10 - The Splunk Visualization is

- We can add the report to Spunk Dashboard with refresh rate 15 seconds, the final result is
Real Time Split Skill Status Summary – Moving Statistics
- To display major moving statistics of all splits , the Splunk command is
-
index=callanalytics logtype=splitskillstatus | dedup split sortby -time | table split, agentsavailable, agentslogon, callsqueue, awt, lwt, ms_asa, ms_acdcalls, ms_avgacdtime, ms_abancalls, ms_abanrate - The Splunk Visualization is
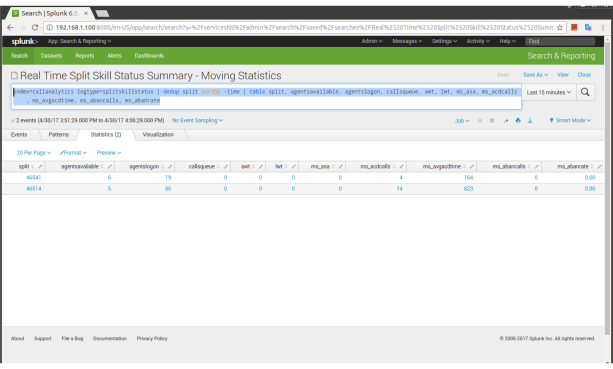
- We can add the report to Spunk Dashboard with refresh rate 15 seconds, the final result is

Real Time Split Skill Status Summary – Interval Statistics
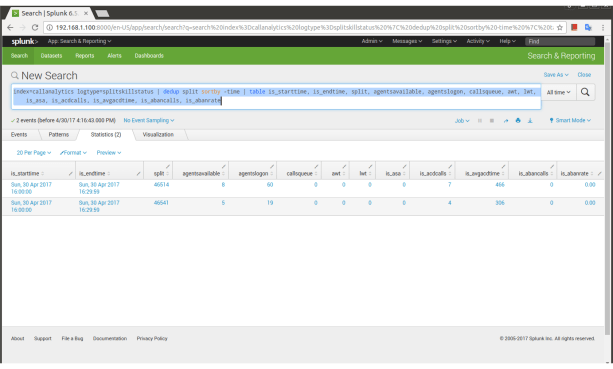
- To display major current interval statistics of all splits , the Splunk command is
-
index=callanalytics logtype=splitskillstatus | dedup split sortby -time | table is_starttime, is_endtime, split, agentsavailable, agentslogon, callsqueue, awt, lwt, is_asa, is_acdcalls, is_avgacdtime, is_abancalls, is_abanrate - The Splunk Visualization is
- We can add the report to Spunk Dashboard with refresh rate 15 seconds, the final result is
Real Time Top 10 Connected Calls Sorted by Duration
- You need to add a report agent to execute the SplitSkillStatus report in order to generate data to Splunk, the command to add this report in tcpgate console is
- add vdnsnapshot all 15 vdnsnapshot_every_15s
- Hint: Execute vdn snapshot report every 15 seconds
- To display top 10 connected calls sorted by duration , the Splunk command is
-
index=callanalytics logtype=vdnsnapshot [search index=callanalytics logtype=vdnsnapshot progress=end | head 1 | fields + timestamp] progress=start callstate!=queued | eval caller = if (len(calling)>len(origcalling),calling,origcalling) | table vdn, split, caller, agentid, answering, callstate, callduration, trunkgroup, trunkmember | sort - callduration limit=10 - The Splunk Visualization is

- We can add the report to Spunk Dashboard with refresh rate 15 seconds, the final result is

Real Time Top 10 Queued Calls Sorted by Duration
- To display top 10 queued calls sorted by duration , the Splunk command is
-
index=callanalytics logtype=vdnsnapshot [search index=callanalytics logtype=vdnsnapshot progress=end | head 1 | fields + timestamp] progress=start callstate=queued | eval caller = if (len(calling)>len(origcalling),calling,origcalling) | table vdn, split, caller, agentid, answering, callstate, callduration, trunkgroup, trunkmember | sort - callduration limit=10 - The Splunk Visualization is
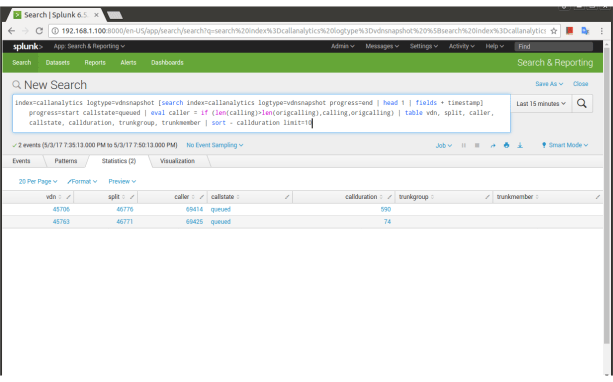
- We can add the report to Spunk Dashboard with refresh rate 15 seconds, the final result is

Real Time AUX Reason with Average Duration
- To display the distribution of AUX reason code together with the average duration, the Splunk command is
-
index=callanalytics logtype=agentsnapshot [search index=callanalytics logtype=agentsnapshot progress=end | head 1 | fields + timestamp] | rename reasoncode as "AUX Reason" | chart count as Count, avg(duration) as Duration by "AUX Reason" | eval Duration=round(Duration,0) - The Splunk Visualization is

- We can add the report to Spunk Dashboard with refresh rate 15 seconds, the final result is
Database Logging
- The following example is to create MySQL database and tables
-
CREATE DATABASE callanalytics;
CREATE USER 'callanalytics'@'localhost' IDENTIFIED BY 'analyticscall';
CREATE USER 'callanalytics'@'%' IDENTIFIED BY 'analyticscall';
GRANT ALL ON callanalytics.* TO 'callanalytics'@'localhost';
GRANT ALL ON callanalytics.* TO 'callanalytics'@'%';
FLUSH PRIVILEGES;
- Use mysql to import table information as follow:
-
mysql -h localhost -u callanalytics -p callanalytics < callanalytics.sql
- Open ODBC Setting, create a System DSN called CALLANALYTICSDBCFG for MySQL ODBC Driver, MySQL is used to store callinfo, abandon and short duration calls details information.
- Edit the parameters follow:
- ca_dbsqltype, supported database such as mysql, mssql and oracle
- ca_dbdsn, enter the ODBC System DSN, the default value is CALLANALYTICSDBCFG
- ca_dbusername, the username used to connect the database, default value is callanalytics
- ca_dbpasswd, the password used to connect the database, default value is encrypted password spT+9YcyxYwZuoi5z2+8Qg==
- ca_writecallinfo, set it to true if CALLINFO data logging is required
- ca_remotedb_errfile, the filename to store temporary SQL statements when database is not reachable
- ca_dbmssqlobject, if you are using mssql and you want to change the object name of the database, then change the value of this parameter
REST Interface
- Add the REST interface port in program console first, the default result is in XML format, JSON format is supported when the parameter payload=json is added at the end of the URL
- add tcp 8088 * * custom carest
- The URL for Abandon Rate query is
- The URL for Top Abandon Rate Agent query is
- The URL for Top Abandon Rate Caller query is
- The URL for Short Duration Rate query is
- The URL for Top Short Duration Rate Agent query is
- The URL for Top Short Duration Rate Caller query is
- The URL for ACHT query is
- The URL for ACHT of calls that reached split is
- The URL for ASA query is
- The URL for Average Waiting Time of queuing call query is
- The URL for Longest Waiting Time of queuing call query is
- The URL for call queue list
- The URL for call answer list
- The URL for query ACD split is
- The URL for split skill status is
- The URL for list all agents is
- The URL for call information is
- The URL for call information of an VDN is
- The URL for VDN report is
Limitation
- This software requires AE server up and running. Missing events will be occurred when the AE server is down or during the fail over from one AE server to another.
Email Notification for Abandon and Short Duration Call
- Edit the following parameters for email notification
- Edit the value of parameter ca_emailabancall, set it to true for email notification of abandon calls
- Edit the value of parameter ca_emailshortcall, set it to true for email notification of short duration calls
- Edit the value of parameter tg_emailserverip to define the IP address of your email server.
- Edit the value of parameter tg_emailsmtpport to define the SMTP port number of your email server. The default value is 25.
- Edit the value of parameter tg_emailusername to define the username of email agent which is responsible to send notification emails.
- Type genpass in the program console to generate an encrypted password string for the email agent, copy the string for later use.
- Edit the value of parameter tg_emailpasswd to define the password of the email agent. The password should be in encrypted format, you can use console command genpass to generate the encrypted password.
- Edit the value of parameter tg_emailsenderdisplay to define the display name of the email agent.
- Edit the value of parameter tg_emailauth to define whether authentication is required between your CallAnalytics machine and the email server. When your email server trust your machine, set it to false, otherwise set it to true.
- Edit the value of parameter tg_emailssl to define whether SSL communication is required for the SMTP session. The default value is false, set it to true when SSL is required.
- Enter the following command in the program console to add your email address
- add email youremail@company.com
- Hint: Replace my email address to yours
- Enter the following command to test the configuration
- test email