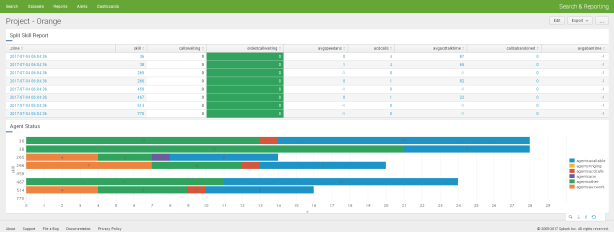
By using ClintSVR and Splunk, we can create wallboard or dashboard for a project very quickly. For example, the following Splunk dashboard can be created in 10 minutes.

Assuming you have a project which has of a group of skills, the first thing to do is to get the real time data from that group of skills. You can use ClintSVR SplitSkillReport which allows you to add a report with multiple skills and then output the real time data to Splunk. For example, the command to add a report in ClintSVR is
add splitskillreport 1 36;38;265;266;459;467;514;770 10 orange
Once you have configured ClintSVR to send data to Splunk, the real time data will be searched in Splunk every 10 seconds. Then you can create the Splunk dashboards by the following procedures.
Split Skill Report Table
- The Splunk Search command (use 15 minutes time range) for a table of Split Skill Report is
- index=cms report=splitskillreport [search index=cms report=splitskillreport skill=770 | head 1 | fields + timestamp] | dedup skill | table _time, skill, callswaiting, oldestcallwaiting, avgspeedans, acdcalls, avgacdtalktime, callsabandoned, avgabantime | sort + skill
- The Splunk Visualization is

- Add to Splunk Dashboard and edit the XML source to configure the refresh rate, for example 15 seconds

- The Dashboard result is

Agent Status Bar Chart
- The Splunk Search command (use 15 minutes time range) for a bar chart of agent status is
- index=cms report=splitskillreport [search index=cms report=splitskillreport skill=770 | head 1 | fields + timestamp] | table skill, agentsavailable, agentsringing, agentsacdcalls, agentsacw, agentsother, agentsauxwork | sort + skill
- The Splunk Visualization is
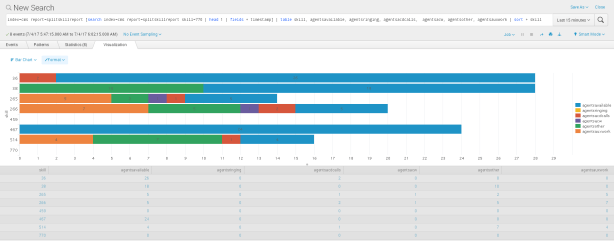
- Add to Splunk Dashboard, the result is
KPI Time Charts
- The Splunk Search commands (use 4 hours time range) for KPI time charts such as calls waiting, oldest call waiting, average speed of answer are
- index=cms report=splitskillreport | timechart avg(callswaiting) by skill usenull=f useother=f
- index=cms report=splitskillreport | timechart avg(callsabandoned) by skill usenull=f useother=f
- index=cms report=splitskillreport oldestcallwaiting > -1 | timechart avg(oldestcallwaiting) by skill usenull=f useother=f
- index=cms report=splitskillreport avgspeedans > -1 | timechart avg(avgspeedans) by skill usenull=f useother=f
- index=cms report=splitskillreport avgacdtalktime > -1 | timechart avg(avgacdtalktime) by skill usenull=f useother=f
- index=cms report=splitskillreport avgabantime > -1 | timechart avg(avgabantime) by skill usenull=f useother=f
- Add each of the result to Splunk Dashboard, the final Dashboard result is
