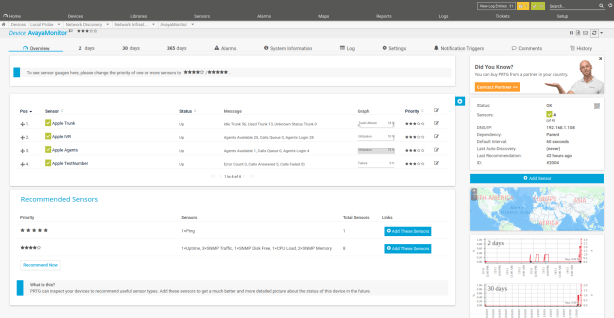
We just integrated the AvayaMonitor with PRTG, please find the screen dumps as following:
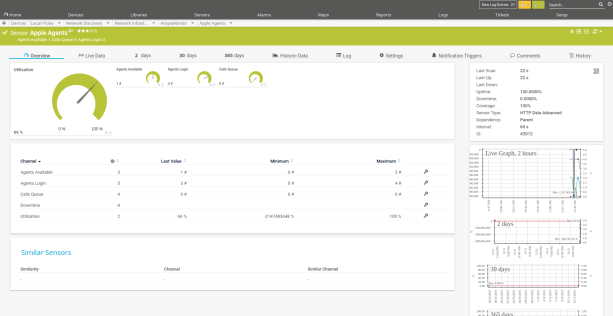
How did you use the HTTP Data Advanced sensor to pull the right information?
The right information is pull from a specific URL and the data is in the JSON payload. For example, the http://IP.PORT/trunk?tac=101 is the URL for query trunk
Δ


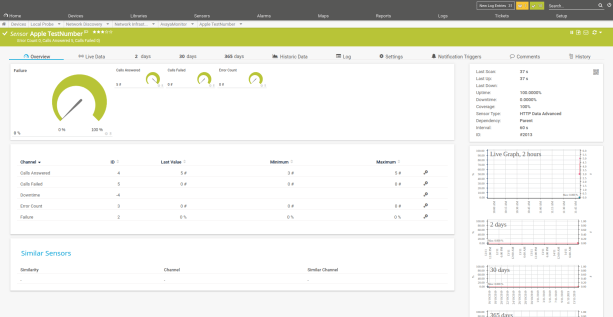

How did you use the HTTP Data Advanced sensor to pull the right information?
The right information is pull from a specific URL and the data is in the JSON payload. For example, the http://IP.PORT/trunk?tac=101 is the URL for query trunk