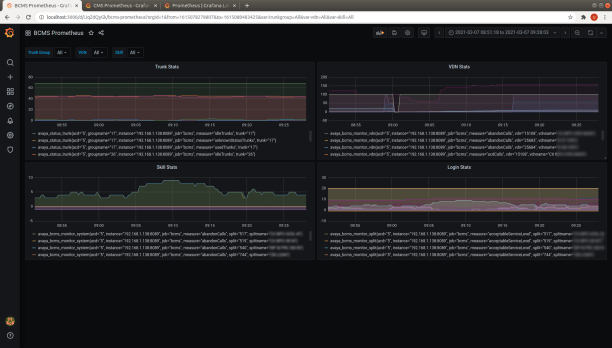
After successfully integration of bcmsSVR with Grafana, we continue to enhance our products to support Prometheus integration by metrics API. Currently, the UPINGET tools clintSVR, bcmsSVR and AvayaMonitor produce the Prometheus metrics and you can easily create time series dashboards in Grafana. Here are some example. If you are interested to quickly create dashboards for you call centers with minimum cost, please contact us by email.