Grafana Loki


Grafana Loki is similar to Splunk, but it is an affordable solution for log data. Granfa offers a Cloud Free account, you can send 50GB of logs to the Grafana cloud for free. This post illustrates the setup of AvayaCDR and AvayaECHI tools and sends the data to Grafana Cloud using the tool Promtail.
Configuration of AvayaCDR and AvayaECHI
- We can configure the AvayaCDR and AvayaECHI to write JSON data to a daily file, the Promtail then monitors the daily file and sends the logs to Loki.
AvayaCDR
- Update 2 AvayaCDR parameters by the following commands. Make sure to change the ownership of the log directory same as the running program AvayaCDR.
update parameter cdr_splunkdataformat json
update parameter cdr_splunklogdir /var/log/avayacdr/splunk/
Promtail Config File
mkdir /var/log/avayacdr/promtail
vi /var/log/avayacdr/promtail/config.yaml
- Paste the following to the newly created config.yaml file. Your user id, API Key and server URL may be different than the example ones.
server:
  http_listen_port: 0
  grpc_listen_port: 0

positions:
  filename: /tmp/positions.yaml

clients:
  - url: https://User:<Your Grafana.com API Key>@logs-prod-us-central1.grafana.net/loki/api/v1/push

scrape_configs:
- job_name: avaya
  static_configs:
  - targets:
      - localhost
    labels:
      job: cdr
      __path__: /var/log/avayacdr/splunk/*.txt
  pipeline_stages:
  - json:
      expressions:
        output: event
        timestamp: time
  - timestamp:
      source: timestamp
      format: Unix
Install Promtail Container
- Run promtail via docker:
cd /var/log/avayacdr/
docker run -d --restart unless-stopped --name promtail_cdr --volume "$PWD/promtail:/etc/promtail" --volume "/var/log/avayacdr:/var/log/avayacdr" grafana/promtail:latest -config.file=/etc/promtail/config.yaml
AvayaECHI
- Update two parameters of AvayaECHI by the following commands. Make sure to change the ownership of the log directory same as the running program AvayaECHI.
update parameter echi_splunk_dataformat json
update parameter echi_splunk_logdir /var/log/avayacdr/splunk/
Promtail Config File
mkdir /var/log/avayaechi/promtail
vi /var/log/avayaechi/promtail/config.yaml
- Paste the following to the newly created config.yaml file. Your user id, API Key and server URL may be different than the example ones.
server:
  http_listen_port: 0
  grpc_listen_port: 0

positions:
  filename: /tmp/positions.yaml

clients:
  - url: https://User:<Your Grafana.com API Key>@logs-prod-us-central1.grafana.net/loki/api/v1/push

scrape_configs:
- job_name: avaya
  static_configs:
  - targets:
      - localhost
    labels:
      job: echi
      __path__: /var/log/avayaechi/splunk/*.txt
  pipeline_stages:
  - json:
      expressions:
        output: event
        timestamp: time
  - timestamp:
      source: timestamp
      format: Unix
Install Promtail Container
- Run promtail via docker:
cd /var/log/avayaechi/
docker run -d --restart unless-stopped --name promtail_echi --volume "$PWD/promtail:/etc/promtail" --volume "/var/log/avayaechi:/var/log/avayaechi" grafana/promtail:latest -config.file=/etc/promtail/config.yaml
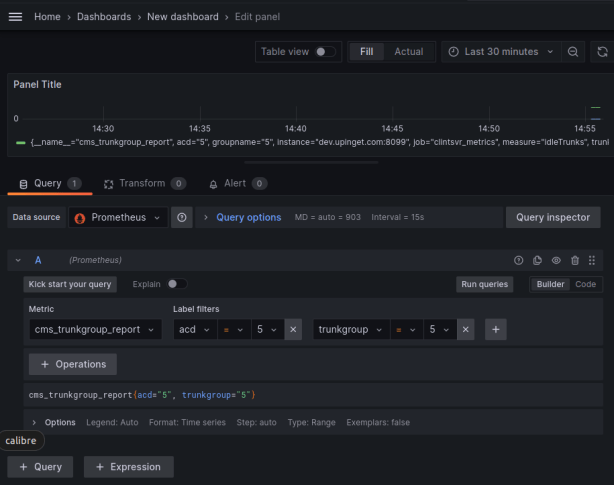
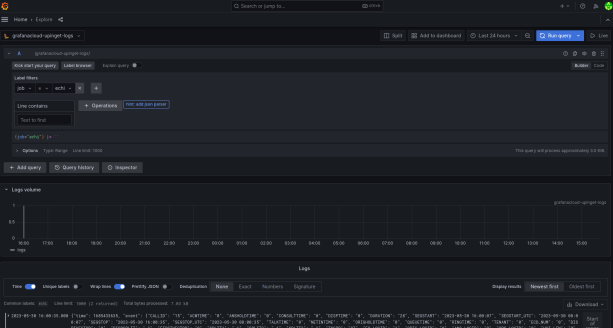
Grafana Explore and Dashboard
Select the Grafana and click Explore, you can explore your CDR and ECHI data.

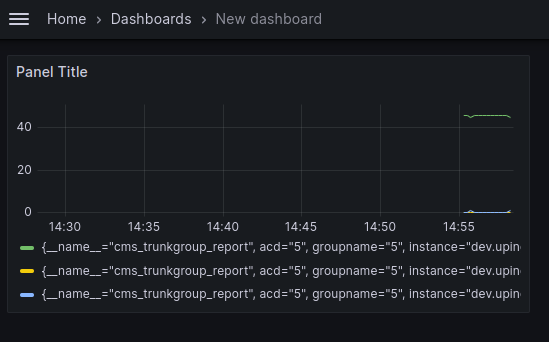
Once the data is ready in Loki, you can select your data by LogQL and create dashboards very easily. For example, the following dashboard shows the number of CDR records over the time range selected.

We will create another post to illustrate how to use LogQL to select the data and create useful dashboards.
If you have questions about the integration, feel free to contact our support.