Grafana Dashboard
This post intends to provide a details procedure to illustrate how easy to add dashboards for Avaya call centre monitoring using clintSVR and bcmsSVR. If you have further questions, you can contact our support by email.
Assuming you have installed Grafana, clintSVR / bcmsSVR and they are working properly.
Firstly, install JSON API data source for Grafana, you can find the plugin by this link and the installation guide is here.
Secondly, enable the RESTful interface port of clintSVR / bcmsSVR.
The command for clintSVR is
add tcp 8099 * * custom clintcgi
The command for bcmsSVR is
add tcp 8088 * * custom bcmsrest
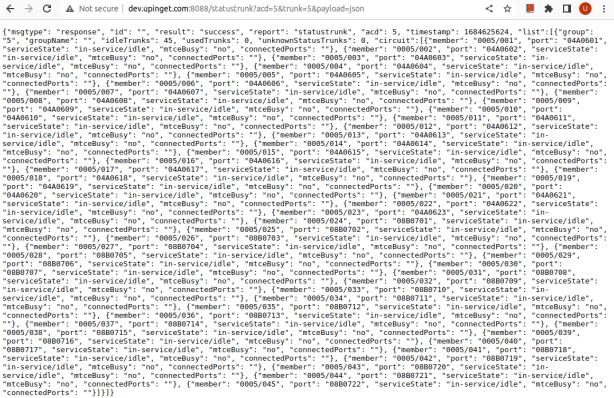
To verify the RESTful interfaces are working properly, we can add a report to clintSVR and bcmsSVR and use a web browser to query the report via the RESTful interfaces. For example, we can add a trunkgroupreport in clintSVR and a statustrunk report in bcmsSVR.
The command for clintSVR is
add trunkgroupreport 5 5 5 Apple_Trunk
** add the trunkgroupreport for acd 5, trunk group 5 and refresh rate 5 seconds

The command for bcmsSVR is
add statustrunk 5 5 5 Apple_Trunk
** add the statustrunk report for acd 5, trunk group 5 and refresh rate 5 seconds
Once confirmed the RESTful interface of clintSVR / bcmsSVR is ready, we can configure the Grafana Data Sources.
Add a data source using JSON API for clintSVR now. For example, to add the clintSVR trunkgroupreport RESTful interface. The following screen dump is for your reference.

To add the bcmsSVR statustrunk RESTful interface, the following screen dump is for your reference.

We can add the Grafana dashboard now.
To monitor real-time trunk group reports using clintSVR. Please provide the acd and trunkgroup Params for the ClintSVR TrunkGroupReport JSON API. The following screen is for your reference.

The Fields mapping is
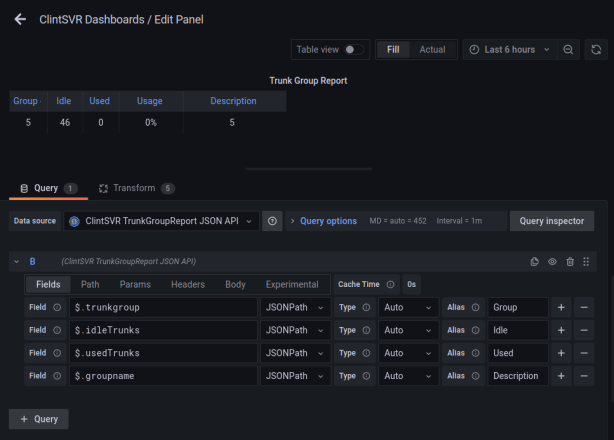
If we want to transform the data according to our requirements, add Transform.

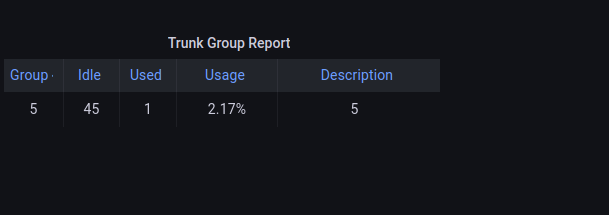
Click the Apply button and you can see the Dashboard like this
To monitor real-time trunk reports using bcmsSVR. Please provide the acd and trunk Params for the bcmsSVR StatusTrunk JSON API. The following screen is for your reference.
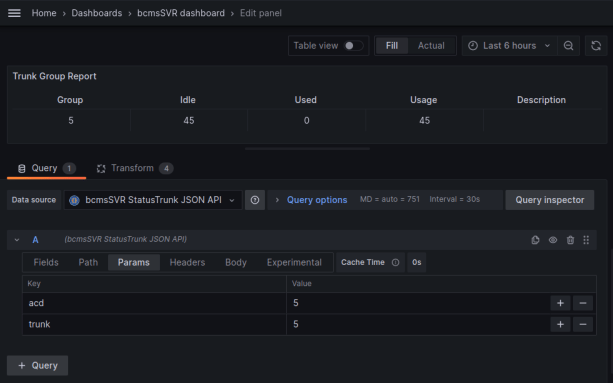
The Fields mapping is

If we want to transform the data according to our requirements, add Transform.

Click the Apply button and you can see the Dashboard like this

Time Series Dashboard
Both clintSVR and bcmsSVR support metrics API in the format of Grafana Prometheus. You can use Prometheus to poll the metrics API in order to build the time series dashboard. The setup procedure is simple. You can follow this guide to install Prometheus first. Then modify the Prometheus config to poll the metrics data from clintSVR and bcmsSVR. For example, the config in our lab is

Add the Prometheus data source, the address is http://localhost:9090

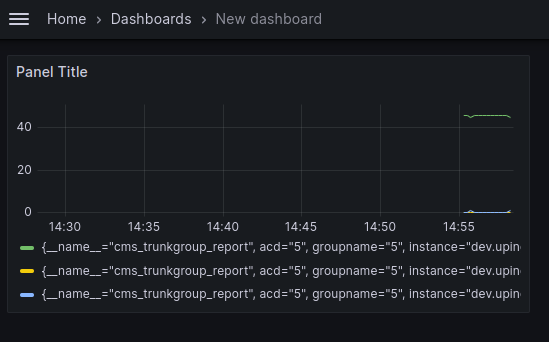
You can add time series clintSVR dashboard now. Since we have added the trunkgroupreport to clintSVR, you can add the time series trunk group dashboard by selecting the appropriate parameters
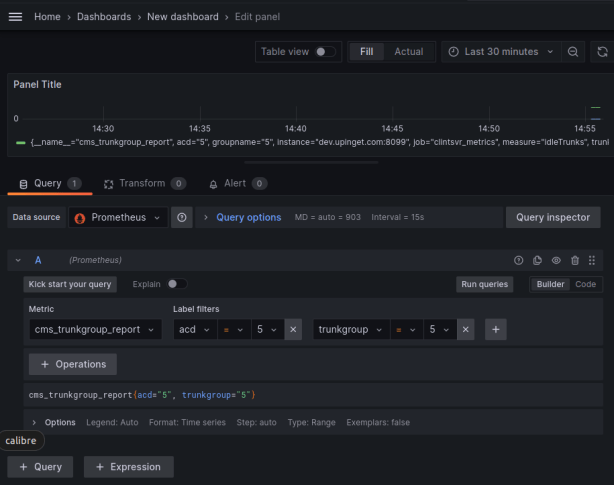
Click the Apply button and you can see the Dashboard like this
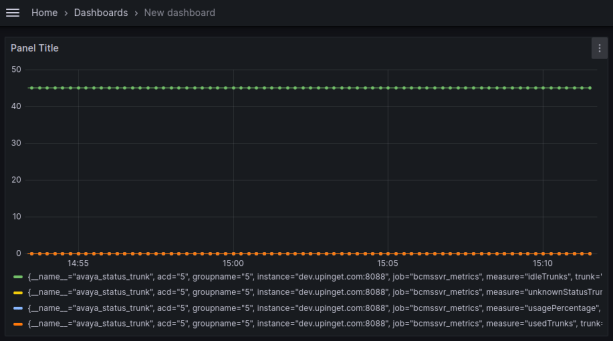
For the bcmsSVR time series trunk dashboard, we can add a dashboard with the following parameters

Click the Apply button and you can see the Dashboard like this
Conclusion
It is very easy to add Avaya real-time dashboard using Grafana and clintSVR / bcmsSVR. if you want to get more information, please contact our support.
