AvayaCDR 1.7.3 just released, this version has the following updates.
1. Fixed duplicate records written into database and Splunk.
AvayaCDR 1.7.3 just released, this version has the following updates.
1. Fixed duplicate records written into database and Splunk.
AvayaCDR 1.7.2 just released, this version has the following updates.
1. Change the sftp from temp to long connection.
2. Add a new parameter called cdr_remotedb_test_columnname and use MAX() function for the testing.
3. Add a try catch block for parsing the Splunk HEC payload.
4. Fix linux move archive file between filesystem.
5. Add cdr_nullcharreplacement parameter. Valid method is “delete” or “space”.
6. Supports pre-defined “unformatted” paramcdr format.
7. Register license to license.upignet.com.
8. Add command “delete paramcdr all”.
AvayaCDR 1.7.1 just released, this version has the following updates.
1. Add cs1k3l (Avaya CS1000 with NEW format and 3 lines records) formats.
2. Add data buffer connector in case the PBX side required the client side to connect to the buffer connector to get the CDR data via TCP socket.
3. Fine tune the objection deletion sequence for program termination.
4. Add tcpgate command feedsql.
Avaya CS1K CDR is now supported by AvayaCDR 1.7.0!
AvayaCDR can capture CS1K CDR from COM port or network network TCP streaming. This version has the following updates:
1. Supports capture CDR records from serial COM port. Supports generic and cs1klf (Avaya CS1000 with NEW format with line feed records) formats.
2. Supports TCP streaming of CDR from Avaya CS1000 with NEW format with line feed records, the paramcdr template called cs1klf is newly introduced.
3. Add new command rotate to rotate the remote database error log file.
AvayaCDR 1.5.25 just released, this version has the following updates.
1. Support multiple instances on Windows and Linux platforms.
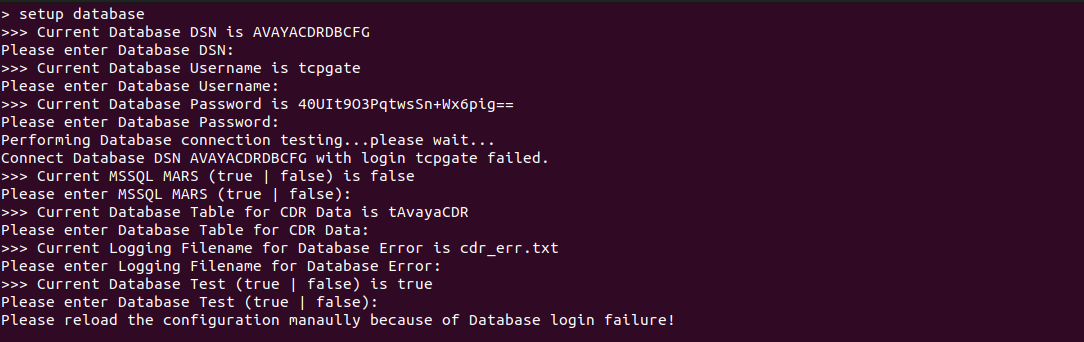
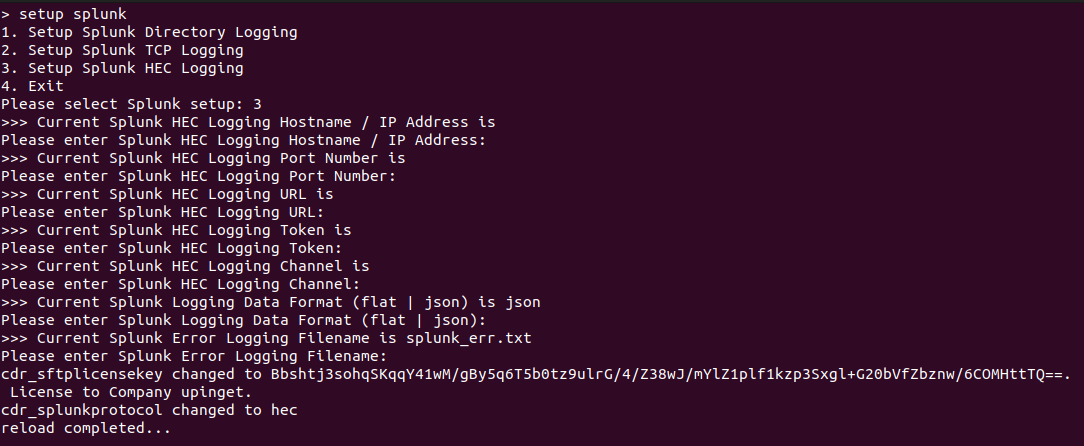
2. Add “setup“, “setup database“, “setup cdrport” and “setup splunk” commands for program configuration.
3. Applied local guard to the telnet command to avoid deadlock of mutex.
The setup commands help the administrator configure the software very easily. Once logged in to the tcpgate console, enter the following commands to configure the software.


If you would like to have a trial, please contact us.
AvayaCDR 1.5.24 just released, this version has the following updates.
1. Lock the remote DB object before testing and writing.
2. Supports 64-bit AvayaCDR and cloudCDR Windows binary.
3. The console can accept multiline commands.
4. Enable saving of JSON data to a local file of a directory that can be defined by a parameter.


Grafana Loki is similar to Splunk, but it is an affordable solution for log data. Granfa offers a Cloud Free account, you can send 50GB of logs to the Grafana cloud for free. This post illustrates the setup of AvayaCDR and AvayaECHI tools and sends the data to Grafana Cloud using the tool Promtail.
update parameter cdr_splunkdataformat json
update parameter cdr_splunklogdir /var/log/avayacdr/splunk/
mkdir /var/log/avayacdr/promtail
vi /var/log/avayacdr/promtail/config.yaml
server:
  http_listen_port: 0
  grpc_listen_port: 0

positions:
  filename: /tmp/positions.yaml

clients:
  - url: https://User:<Your Grafana.com API Key>@logs-prod-us-central1.grafana.net/loki/api/v1/push

scrape_configs:
- job_name: avaya
  static_configs:
  - targets:
      - localhost
    labels:
      job: cdr
      __path__: /var/log/avayacdr/splunk/*.txt
  pipeline_stages:
  - json:
      expressions:
        output: event
        timestamp: time
  - timestamp:
      source: timestamp
      format: Unix
cd /var/log/avayacdr/
docker run -d --restart unless-stopped --name promtail_cdr --volume "$PWD/promtail:/etc/promtail" --volume "/var/log/avayacdr:/var/log/avayacdr" grafana/promtail:latest -config.file=/etc/promtail/config.yaml
update parameter echi_splunk_dataformat json
update parameter echi_splunk_logdir /var/log/avayacdr/splunk/
mkdir /var/log/avayaechi/promtail
vi /var/log/avayaechi/promtail/config.yaml
server:
  http_listen_port: 0
  grpc_listen_port: 0

positions:
  filename: /tmp/positions.yaml

clients:
  - url: https://User:<Your Grafana.com API Key>@logs-prod-us-central1.grafana.net/loki/api/v1/push

scrape_configs:
- job_name: avaya
  static_configs:
  - targets:
      - localhost
    labels:
      job: echi
      __path__: /var/log/avayaechi/splunk/*.txt
  pipeline_stages:
  - json:
      expressions:
        output: event
        timestamp: time
  - timestamp:
      source: timestamp
      format: Unix
cd /var/log/avayaechi/
docker run -d --restart unless-stopped --name promtail_echi --volume "$PWD/promtail:/etc/promtail" --volume "/var/log/avayaechi:/var/log/avayaechi" grafana/promtail:latest -config.file=/etc/promtail/config.yaml
Select the Grafana and click Explore, you can explore your CDR and ECHI data.


Once the data is ready in Loki, you can select your data by LogQL and create dashboards very easily. For example, the following dashboard shows the number of CDR records over the time range selected.
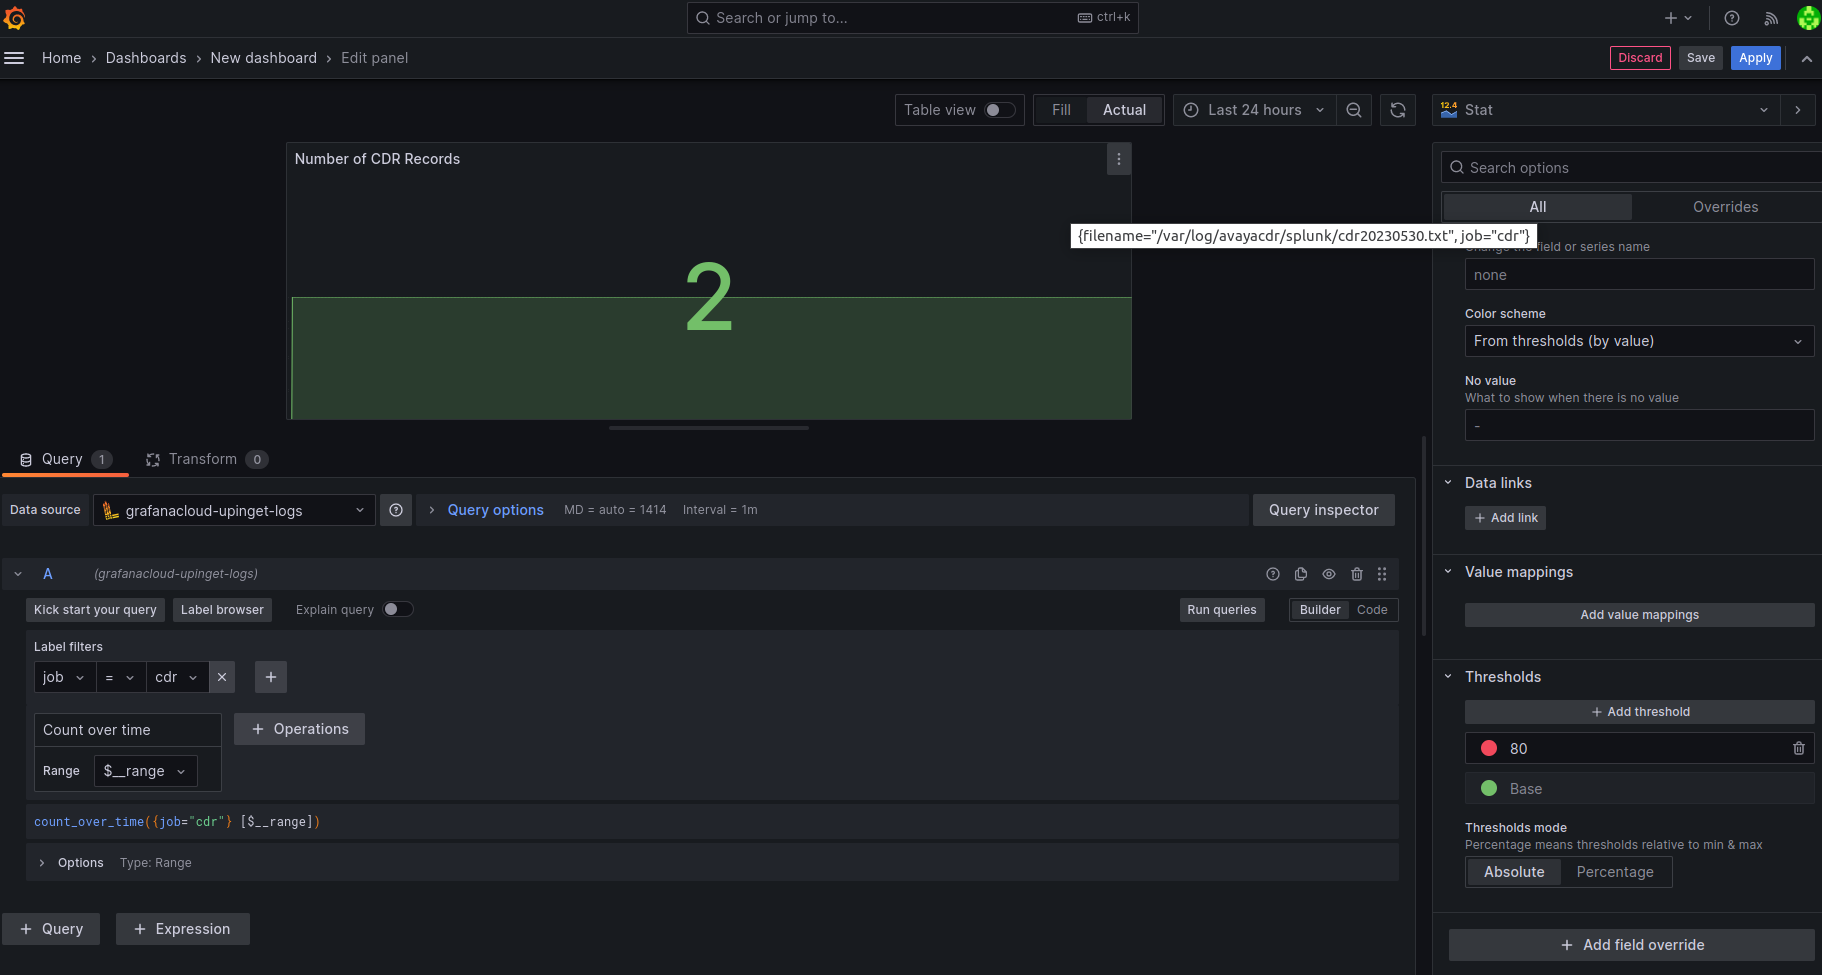
We will create another post to illustrate how to use LogQL to select the data and create useful dashboards.
If you have questions about the integration, feel free to contact our support.
This post intends to provide a details procedure to illustrate how easy to add dashboards for Avaya call centre monitoring using clintSVR and bcmsSVR. If you have further questions, you can contact our support by email.
Assuming you have installed Grafana, clintSVR / bcmsSVR and they are working properly.
Firstly, install JSON API data source for Grafana, you can find the plugin by this link and the installation guide is here.
Secondly, enable the RESTful interface port of clintSVR / bcmsSVR.
The command for clintSVR is
add tcp 8099 * * custom clintcgi
The command for bcmsSVR is
add tcp 8088 * * custom bcmsrest
To verify the RESTful interfaces are working properly, we can add a report to clintSVR and bcmsSVR and use a web browser to query the report via the RESTful interfaces. For example, we can add a trunkgroupreport in clintSVR and a statustrunk report in bcmsSVR.
The command for clintSVR is
add trunkgroupreport 5 5 5 Apple_Trunk
** add the trunkgroupreport for acd 5, trunk group 5 and refresh rate 5 seconds

The command for bcmsSVR is
add statustrunk 5 5 5 Apple_Trunk
** add the statustrunk report for acd 5, trunk group 5 and refresh rate 5 seconds

Once confirmed the RESTful interface of clintSVR / bcmsSVR is ready, we can configure the Grafana Data Sources.
Add a data source using JSON API for clintSVR now. For example, to add the clintSVR trunkgroupreport RESTful interface. The following screen dump is for your reference.

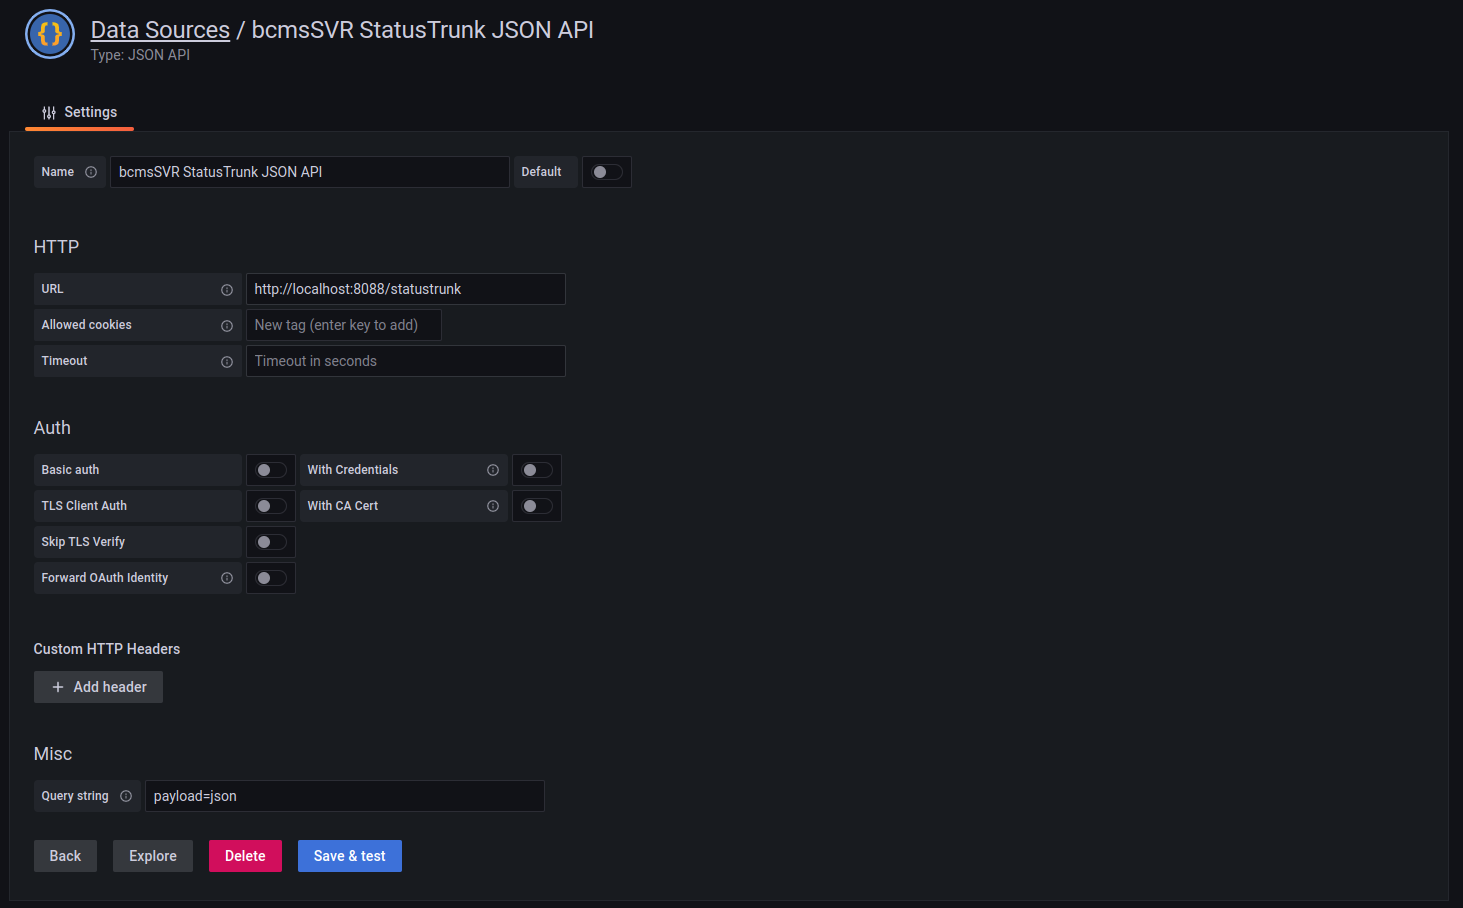
To add the bcmsSVR statustrunk RESTful interface, the following screen dump is for your reference.
We can add the Grafana dashboard now.
To monitor real-time trunk group reports using clintSVR. Please provide the acd and trunkgroup Params for the ClintSVR TrunkGroupReport JSON API. The following screen is for your reference.

The Fields mapping is
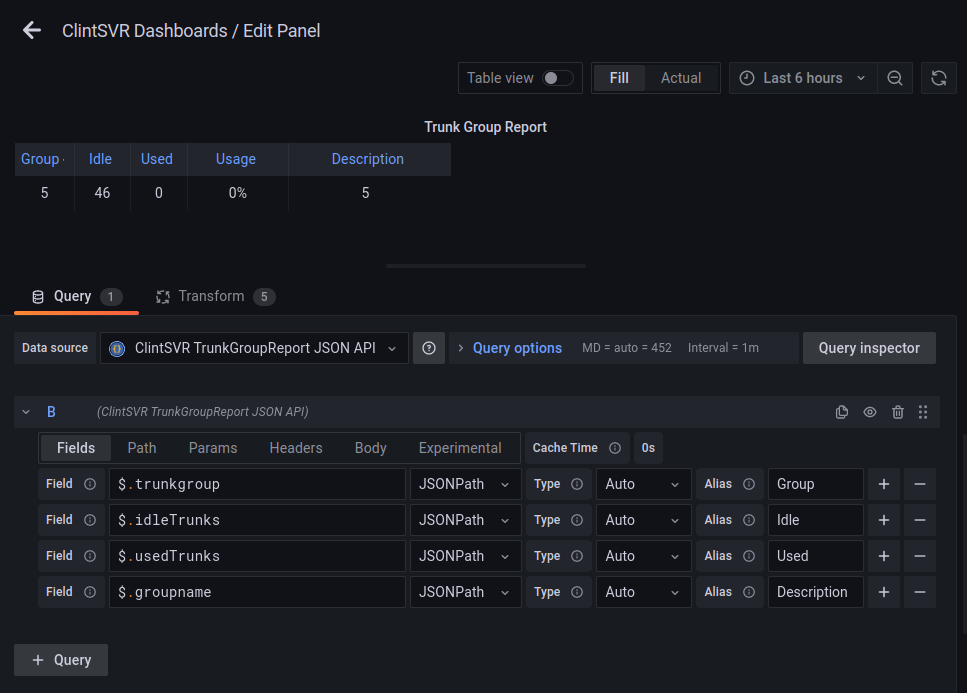
If we want to transform the data according to our requirements, add Transform.
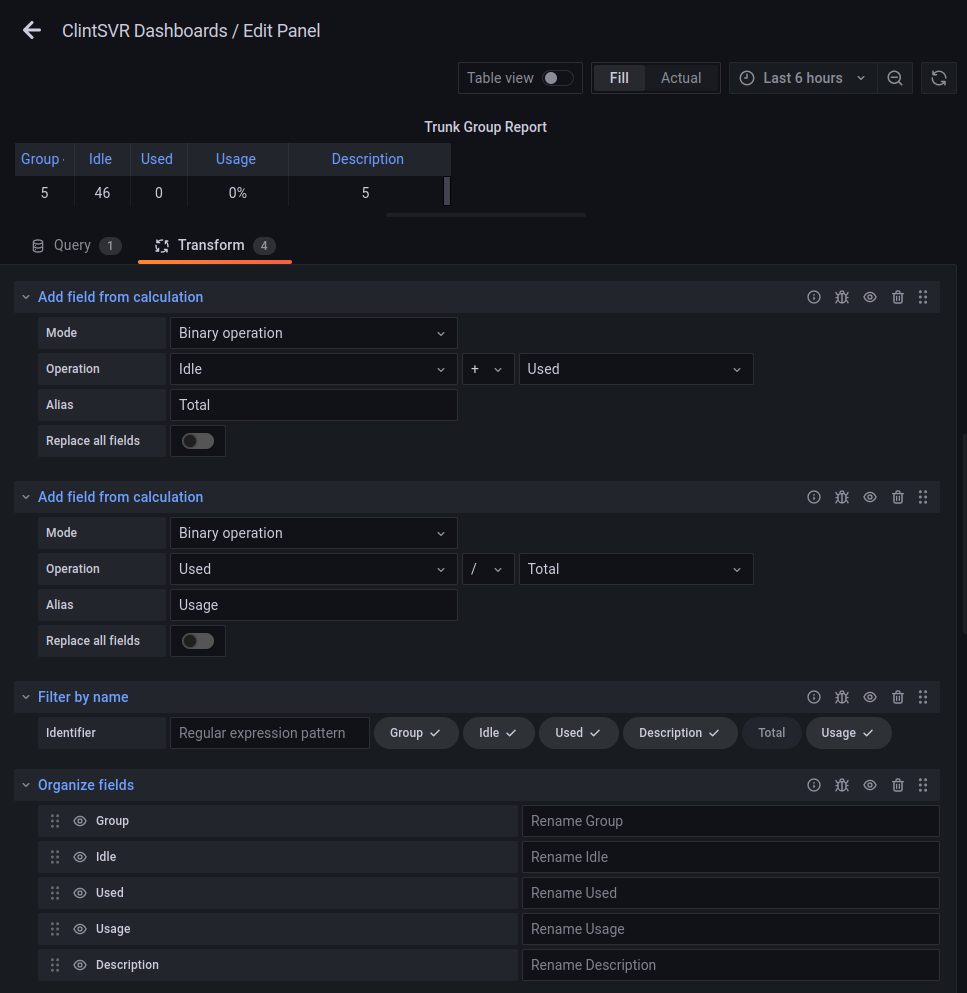
Click the Apply button and you can see the Dashboard like this

To monitor real-time trunk reports using bcmsSVR. Please provide the acd and trunk Params for the bcmsSVR StatusTrunk JSON API. The following screen is for your reference.
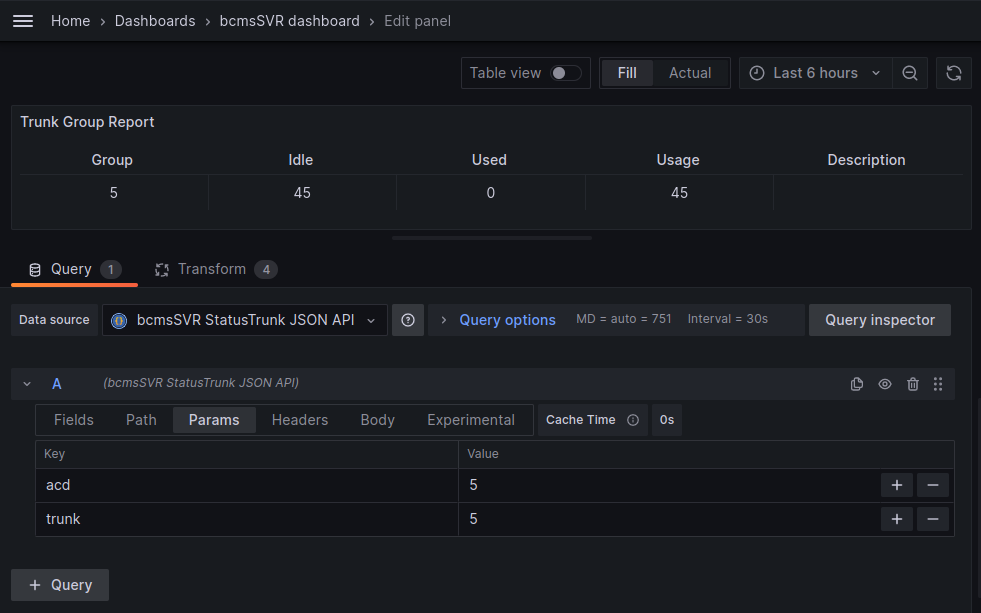
The Fields mapping is

If we want to transform the data according to our requirements, add Transform.

Click the Apply button and you can see the Dashboard like this

Both clintSVR and bcmsSVR support metrics API in the format of Grafana Prometheus. You can use Prometheus to poll the metrics API in order to build the time series dashboard. The setup procedure is simple. You can follow this guide to install Prometheus first. Then modify the Prometheus config to poll the metrics data from clintSVR and bcmsSVR. For example, the config in our lab is

Add the Prometheus data source, the address is http://localhost:9090

You can add time series clintSVR dashboard now. Since we have added the trunkgroupreport to clintSVR, you can add the time series trunk group dashboard by selecting the appropriate parameters
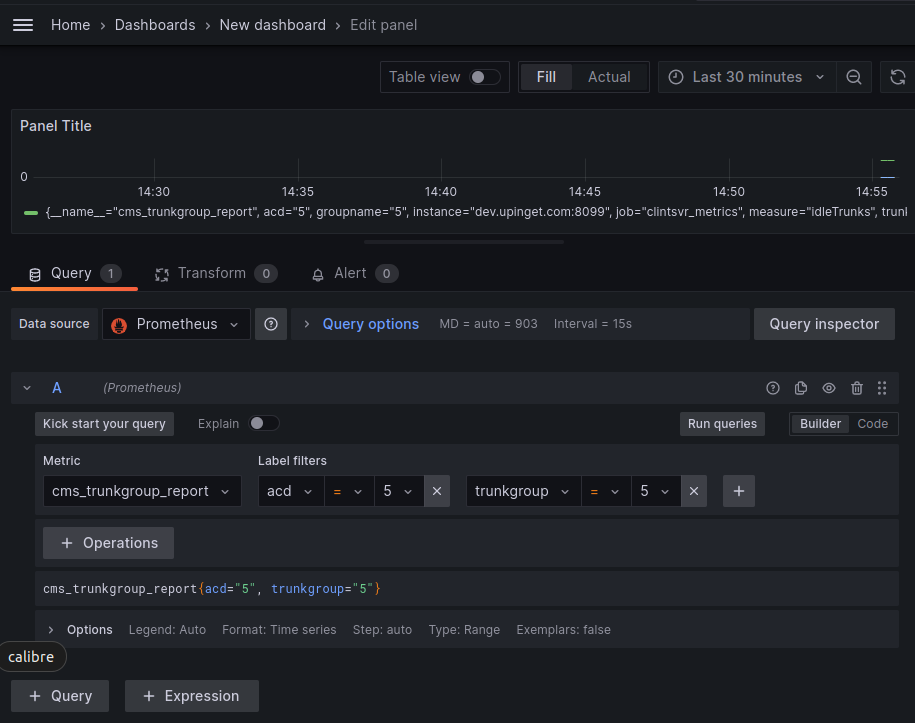
Click the Apply button and you can see the Dashboard like this

For the bcmsSVR time series trunk dashboard, we can add a dashboard with the following parameters
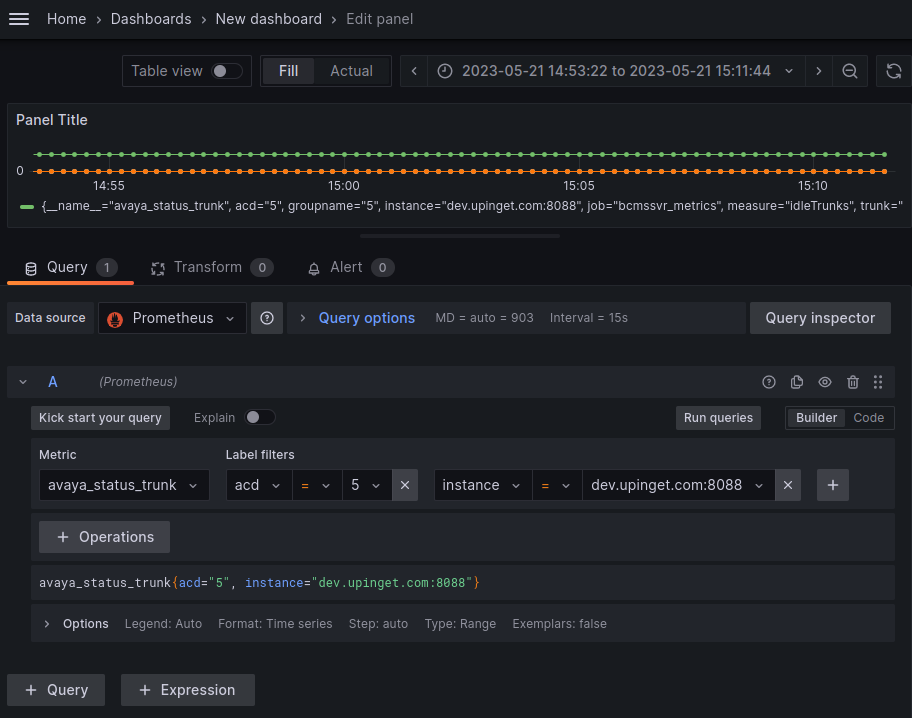
Click the Apply button and you can see the Dashboard like this

It is very easy to add Avaya real-time dashboard using Grafana and clintSVR / bcmsSVR. if you want to get more information, please contact our support.


AvayaECHI and CloudCDR now supports upload of ECH or CDR files to AWS S3. In the S3, you can configure trigger to execute Lambda function to insert the data to database such as Dynamodb. If you have such use cases and want a trial, please contact us by email.
