AvayaECHI 1.1.13 just released, this version has the following updates:
1. Supports sending data to Splunk using HTTP Event Collector method.
AvayaECHI 1.1.13 just released, this version has the following updates:
1. Supports sending data to Splunk using HTTP Event Collector method.
clintSVR 1.3.8 just released. The updates are:
1. Supports receiving of RT-socket split skill data and provides REST, WebSocket and database interfaces to access the real time data.
2. Supports white-list of IP address for tcpgate telnet port. The localhost IP address is white-listed by default.
clintSVR 1.3.7 just released, the updates are:
1. Supports new report called “auxagentreport” by REST, API and WebSocket interfaces.
2. Fixed error code extraction failed issue for multiAgentAddSkill, multiAgentDeleteSkill and multiAgentModifySkill functions.
AvayaECHI 1.1.12 just released. The updates are:
1. Recompile Linux distribution to fix segmentation fault that caused by strtok function.
2. Add a converter type called “apsr18” to differentiate the R18 report from converter type “aps”.
Introduction

CMSLight is a visual notification software for Avaya CMS. The software is integrated with a USB lighting device and showing critical situation by turning on the lighting device and change the color to RED when the number of waiting calls and the oldest waiting time exceed threshold values. The software is designed for the Avaya CMS, it requires clintSVR which gets the real time data directly from Avaya CMS. The CMSLight provides the following features:
Supported USB lighting device
Supported platform
CMSLight Software Windows Installation


Background
With reference to the Avaya CMS External Call History Interface document and the data fields, we can produce many use cases by using AvayaECHI tool and Splunk. The following guide assumes you already installed the AvayaECHI tool and imported the data to Splunk.
Caller On Hold Reports
index=echi ANSHOLDTIME>0 HELD>0 TRANSFERRED=0 | table ACD, CALLID, SEGMENT, SEGSTART, SEGSTOP, DISPSPLIT, DISPVDN, CALLING_PTY, DIALED_NUM, ANSLOGIN, AGT_RELEASED, TALKTIME, ANSHOLDTIME, HELD, QUEUETIME
index=echi ANSLOGIN=* DISPSPLIT=* TRANSFERRED=0 HOLDABN=1 | table ACD, ANSLOGIN, DISPSPLIT, TALKTIME, ANSHOLDTIME, HELD, HOLDABN
index=echi ANSLOGIN=* DISPSPLIT=* TRANSFERRED=0 HOLDABN=1 | table ACD, ANSLOGIN | stats count as AbandonCalls by ACD, ANSLOGIN | sort limit=10 - AbandonCalls
Caller Calls Reports
index=echi CALLING_PTY=XXXXXXXXindex=echi CALLING_PTY=123*Outbound Calls Reports
index=echi ORIGLOGIN=XXXXXindex=echi CALLING_PTY=XXXXXQueue Wait Time Reports
index=echi QUEUETIME>=60 | table ACD, CALLID, SEGMENT, SEGSTART, SEGSTOP, DISPSPLIT, DISPVDN, CALLING_PTY, DIALED_NUM, ANSLOGIN, AGT_RELEASED, TALKTIME, ANSHOLDTIME, HELD, QUEUETIME | sort - QUEUETIME
Short Duration Reports
index=echi TALKTIME>0 TALKTIME<5 TRANSFERRED=0 | table ACD, CALLID, SEGMENT, SEGSTART, SEGSTOP, DISPSPLIT, DISPVDN, CALLING_PTY, DIALED_NUM, ANSLOGIN, AGT_RELEASED, TALKTIME, ANSHOLDTIME, HELD, QUEUETIME
index=echi TALKTIME>0 TALKTIME<5 TRANSFERRED=0 | stats count as ShortCalls by ACD, ANSLOGIN | sort limit=10 - ShortCalls
Call Profile Reports
index=echi ACD=X CALL_DISP=3 DISPSPLIT=Y | rangemap field=QUEUETIME short=0-15 medium=16-60 default=long | bucket _time span=1h | timechart count by range
index=echi ACD=X CALL_DISP=3 DISPVDN=Y | rangemap field=QUEUETIME short=0-15 medium=16-60 default=long | bucket _time span=1h | timechart count by range
index=echi ACD=X CALL_DISP=2 DISPSPLIT=Y | rangemap field=QUEUETIME short=0-15 medium=16-60 default=long | bucket _time span=1h | timechart count by range
index=echi ACD=X CALL_DISP=2 DISPVDN=Y | rangemap field=QUEUETIME short=0-15 medium=16-60 default=long | bucket _time span=1h | timechart count by range
Find All Activity For A Specific Agent
index=echi ACD=X (ANSLOGIN=YYYYY OR ORIGLOGIN=YYYYY)Find Long Or Short Customer Calls
index=echi ACD=X TALKTIME<Y CALLING_PTY=* ANSLOGIN=* | table ACD, ANSLOGIN, DISPVDN, DISPSPLIT, CALLING_PTYindex=echi ACD=X TALKTIME>Z CALLING_PTY=* ANSLOGIN=* | table ACD, ANSLOGIN, DISPVDN, DISPSPLIT, CALLING_PTYFind The Destination Of Transfer or Conference Calls
index=echi TRANSFERRED=1 OR CONFERENCE=1 ORIGLOGIN=* DIALED_NUM=* | table ACD, ORIGLOGIN, CALLING_PTY, DIALED_NUMFind Abandoned Calls For A Specific Skill
index=echi CALL_DISP=3 DISPSPLIT=X | table CALLING_PTY, DIALED_NUMIdentify Repeat Callers Whether Answered Or Abandoned
index=echi DISPSPLIT=X CALL_DISP=3 OR CALL_DISP=2 | stats count by CALLING_PTY | sort - count
List Last Call Work Codes By Agent
index=echi LASTCWC=*Outbound Calls with Aux Reason Code Reports
index=echi ORIGLOGIN=* ORIGREASON=X | table ORIGLOGIN, ORIGREASON, DIALED_NUM, TALKTIME, DURATION
Agent Disconnects First Reports
index=echi ANSLOGIN=* AGT_RELEASED=1 CONFERENCE=0 TRANSFERRED=0 | table ACD, ANSLOGIN, DISPSPLIT, CALLING_PTY, TALKTIME, AGT_RELEASED
index=echi ANSLOGIN=* AGT_RELEASED=1 CONFERENCE=0 TRANSFERRED=0 | stats count as DropCalls by ACD, ANSLOGIN | sort limit=10 - DropCalls
Agent Transferred Call to Same VDN Reports
index=echi ANSLOGIN=* TRANSFERRED=1 DIALED_NUM=* | where DISPVDN=DIALED_NUM | table ACD, ANSLOGIN, TRANSFERRED, DISPVDN, DIALED_NUM
index=echi ANSLOGIN=* TRANSFERRED=1 DIALED_NUM=* | where DISPVDN=DIALED_NUM | stats count as TransferredCalls by ACD, ANSLOGIN | sort limit=10 - TransferredCallsCalls Answered Skill Level Reports
index=echi ACD=X DISPSPLIT=Y ANSLOGIN=* | table ACD, DISPSPLIT, ANSLOGIN, DISPSKLEVEL, TALKTIME | sort + DISPSPLIT, DISPSKLEVEL
index=echi ACD=X DISPSPLIT=Y ANSLOGIN=* | stats count as NumCalls by DISPSKLEVEL
Long Wrap-up Time Reports
index=echi ANSLOGIN=* ACWTIME>0 | table ACD, ANSLOGIN, DISPSPLIT, TALKTIME, ACWTIME, ANSHOLDTIME | sort - ACWTIME
index=echi ANSLOGIN=* ACWTIME>0 | stats sum(ACWTIME) as WrapUpTime by ACD, ANSLOGIN | sort limit=10 - WrapUpTime
Call Handling Time Reports
index=echi ACD=X DISPSPLIT=Y ANSLOGIN=* | eval TotalTime=TALKTIME+ANSHOLDTIME+ACWTIME | table ACD, ANSLOGIN, DISPSPLIT, TALKTIME, ANSHOLDTIME, HELD, ACWTIME, TotalTime | sort + ACD, ANSLOGIN
index=echi ACD=X DISPSPLIT=Y ANSLOGIN=* | stats sum(ACWTIME) as ACWTime, sum(TALKTIME) as TalkTime, sum(ANSHOLDTIME) as HoldTime by ACD, ANSLOGIN | fields - ACD
clintSVR 1.3.6 just released, a custom real time report called “upsplitskillreport” which is modified from the standard Split/Skill Report is provided for customers who subscribe the annual email support service from UPINGET Technologies. This report provides additional CMS real time database items such as:
The report template “upsplitskillreport” can be obtained via UPINGET support service. You can follow the procedure below to create and upload the template to your CMS server.


Add and Delete Report in TcpGate Console
REST Interface
AvayaECHI 1.1.11 just released. The updates are
1. A parameter called “echi_splunk_logdir” is added for storing splunk log in specified directory. We can configure Splunk Universial Forwarder to import the splunk log to Splunk to prevent data loss when there is network issue.
clintSVR 1.3.5 just released, the updates are
1. Supports CMS 18 Multi Agent Add/Change/Delete Skill features.
2. Fixed telnet malfunction after deletion of report for Linux 64 bit OS.
3. Add report type rtashuffling and rtasnapshot for CustomRTA Splunk logging.
4. Supports debug log and the log file name is debug.txt
5. Fixed trunk group report REST interface without trunk group name.
6. When input object mismatch with output result, the default action is to return immediately to prevent incorrect data logging for splunk and database interfaces. This is overridden by a parameter called cs_iomismatch when it’s value is set to true.
7. Add escape character for special character in database logging.
By using ClintSVR and Splunk, we can create wallboard or dashboard for a project very quickly. For example, the following Splunk dashboard can be created in 10 minutes.

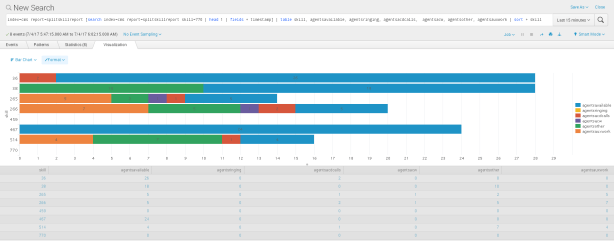
Assuming you have a project which has of a group of skills, the first thing to do is to get the real time data from that group of skills. You can use ClintSVR SplitSkillReport which allows you to add a report with multiple skills and then output the real time data to Splunk. For example, the command to add a report in ClintSVR is
add splitskillreport 1 36;38;265;266;459;467;514;770 10 orange
Once you have configured ClintSVR to send data to Splunk, the real time data will be searched in Splunk every 10 seconds. Then you can create the Splunk dashboards by the following procedures.
Split Skill Report Table


Agent Status Bar Chart
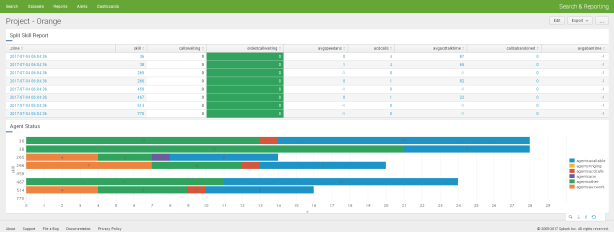
KPI Time Charts
