Archive for the ‘BCMS’ Category

bcmsSVR 2.3.1 Released

Posted: February 8, 2025 in BCMS, News

bcmsSVR 2.3.1 just released, this version has the following updates.

1. Add dynamic fields agentsAUX10-99 to the bcmsmonitorsplitsla and bcmsmonitorsplitstatus.
2. Fixed report deletion bug due to deadlock happened to access the bcms mutex for the deleting of the report threads.
3. Add new command disp connectionpool to display the OSSI connection pool status.
4. Only check OSSI connection status when the maximum IDLE time is exceeded.
5. Add “list emergency” REST API.
6. Supports postgresql database.

bcmsSVR Reports with AUX Reason Codes

Posted: December 7, 2024 in BCMS, TSAPI

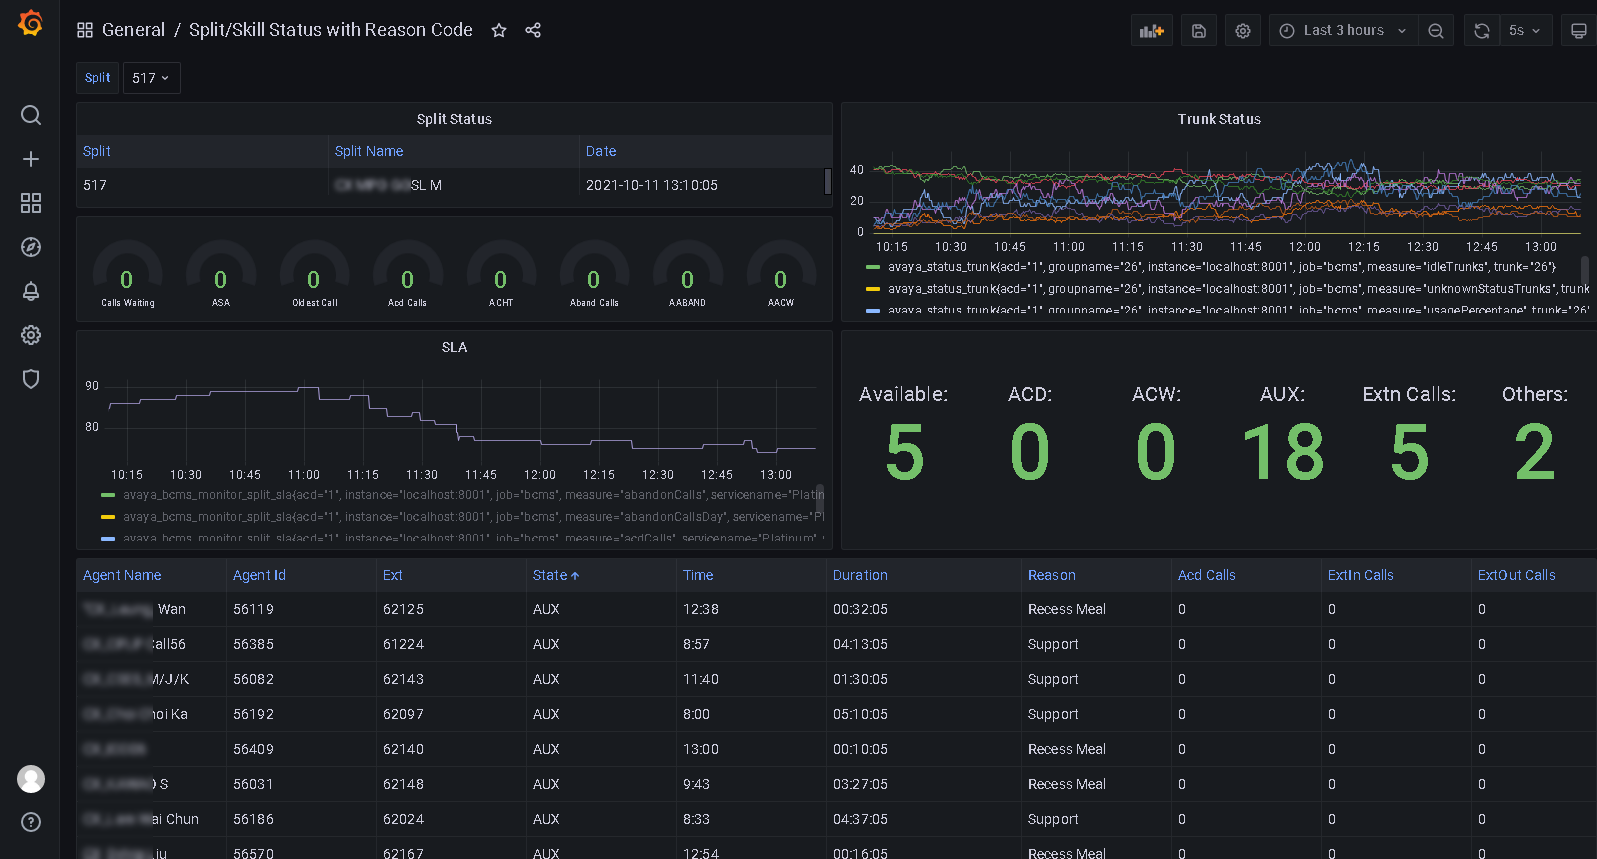
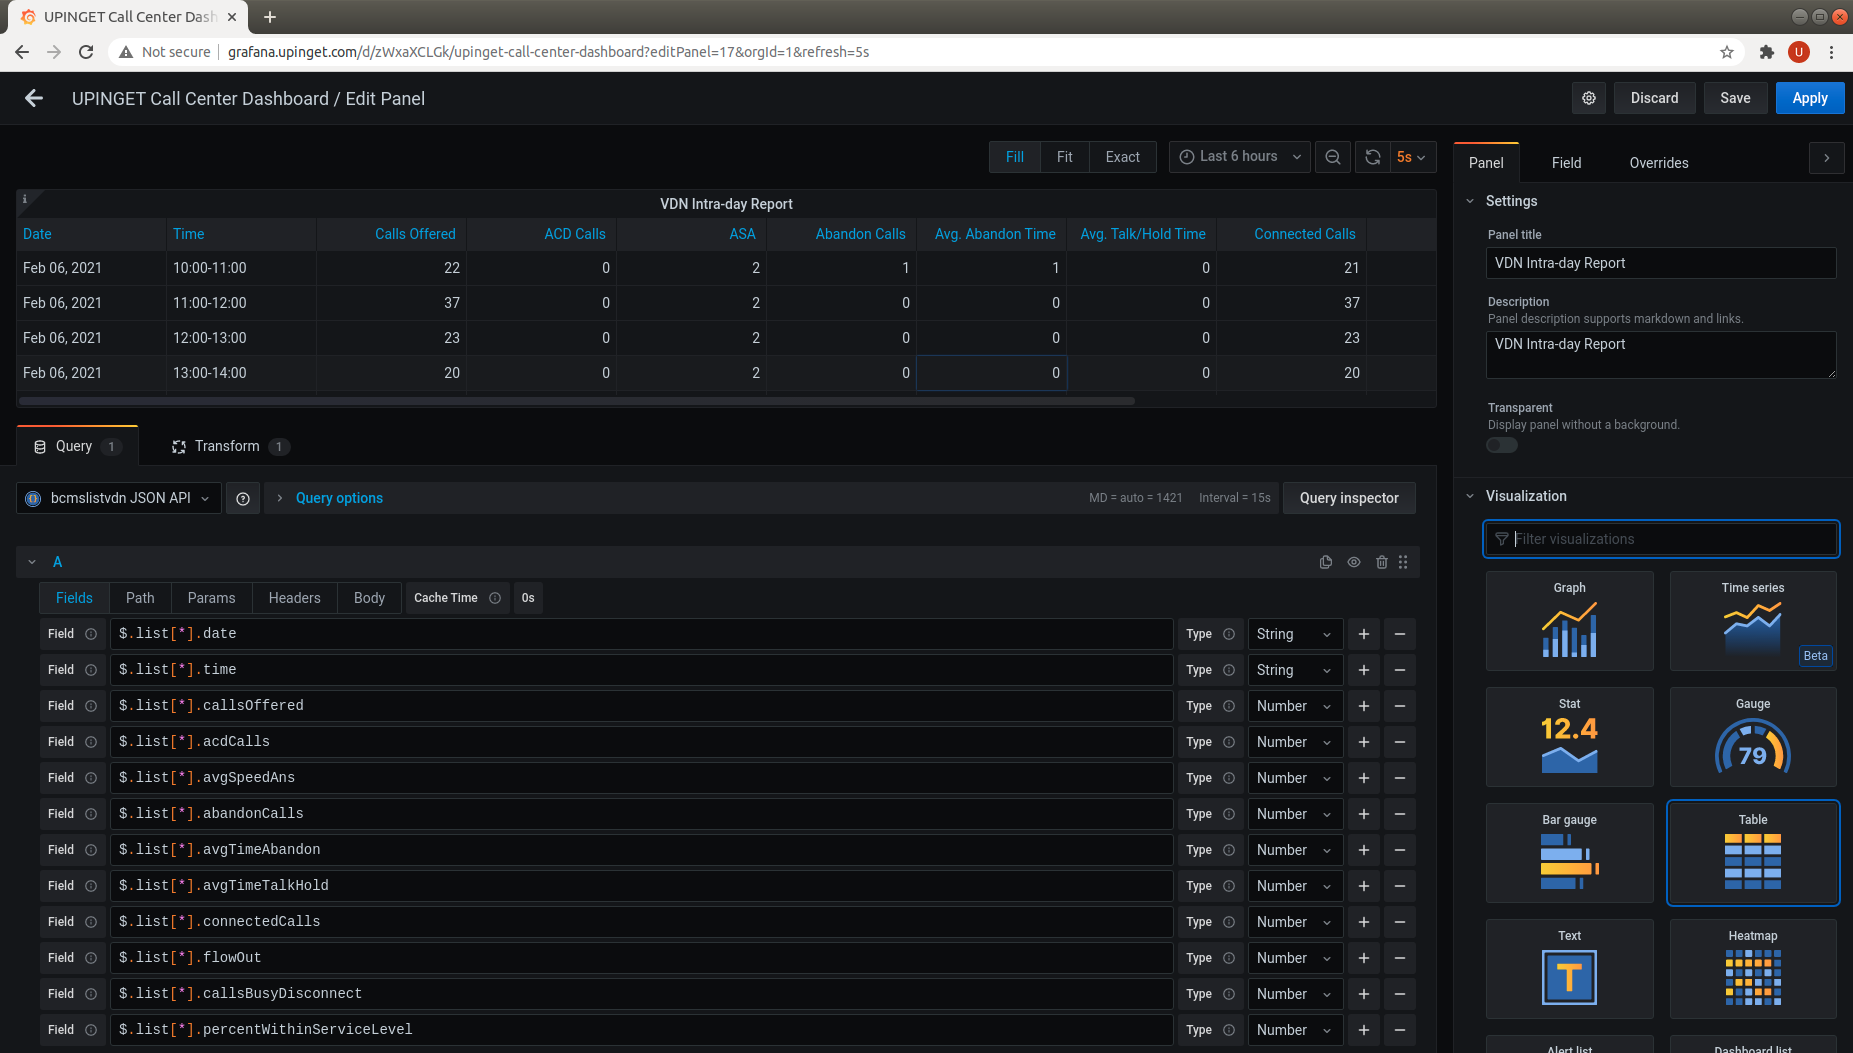
bcmsSVR can integrate with ctiSVR now to get AUX reason codes for two real-time reports. This makes the two real-time reports have similar look and feel as CMS reports. The JSON format of the two reports are illustrated as follows. We can use Grafana to query the two reports and produce useful and beautiful dashboards. You can reference this for using Grafana to monitor call center.

1. monitor bcms split status (real-time)

{
  "msgtype": "response",
  "id": "",
  "result": "success",
  "report": "bcmsmonitorsplitstatus",
  "acd": 5,
  "timestamp": 1733519669,
  "list": [
    {
      "split": "123",
      "splitName": "ABC",
      "callsWaiting": 0,
      "oldestCallWaiting": 0,
      "acceptableServiceLevel": 20,
      "percentWithinServiceLevel": -1,
      "agentsStaffed": 1,
      "agentsAvailable": 0,
      "agentsACD": 0,
      "agentsACW": 0,
      "agentsAUX": 1,
      "agentsAUX0": 0,
      "agentsAUX1": 0,
      "agentsAUX2": 0,
      "agentsAUX3": 1,
      "agentsAUX4": 0,
      "agentsAUX5": 0,
      "agentsAUX6": 0,
      "agentsAUX7": 0,
      "agentsAUX8": 0,
      "agentsAUX9": 0,
      "agentsExtnCalls": 0,
      "agentsOthers": 0,
      "avgSpeedAns": 0,
      "abandonCalls": 0,
      "avgTimeAbandon": 0,
      "acdCalls": 0,
      "avgTimeTalk": 0,
      "avgAfterCall": -1,
      "agent": [
        {
          "agentName": "YP",
          "agentID": "19900",
          "extension": "10001",
          "state": "AUX",
          "reasoncode": "3",
          "time": "5:14",
          "duration": 29,
          "acdCalls": 0,
          "extInCalls": 0,
          "extOutCalls": 0
        }
      ]
    }
  ]
}

2. monitor bcms split sla (real-time with day summary)

{
  "msgtype": "response",
  "id": "",
  "result": "success",
  "report": "bcmsmonitorsplitsla",
  "acd": 5,
  "timestamp": 1733519846,
  "split": "123",
  "serviceName": "ABC",
  "callsWaiting": 0,
  "oldestCallWaiting": 0,
  "displayOldestCallWaiting": "00:00",
  "agentsStaffed": 1,
  "agentsAvailable": 0,
  "agentsACD": 0,
  "agentsACW": 0,
  "agentsAUX": 1,
  "agentsAUX0": 0,
  "agentsAUX1": 0,
  "agentsAUX2": 0,
  "agentsAUX3": 1,
  "agentsAUX4": 0,
  "agentsAUX5": 0,
  "agentsAUX6": 0,
  "agentsAUX7": 0,
  "agentsAUX8": 0,
  "agentsAUX9": 0,
  "agentsExtnCalls": 0,
  "agentsOthers": 0,
  "acdCalls": 0,
  "abandonCalls": 0,
  "avgSpeedAns": 0,
  "displayAvgSpeedAns": "00:00",
  "avgTimeAbandon": 0,
  "displayAvgTimeAbandon": "00:00",
  "avgTimeTalk": 0,
  "displayAvgTimeTalk": "00:00",
  "totalTimeAfterCall": 0,
  "displayTotalTimeAfterCal": "00:00",
  "percentWithinServiceLevel": -1,
  "acdCallsDay": 0,
  "abandonCallsDay": 0,
  "avgSpeedAnsDay": 0,
  "displayAvgSpeedAnsDay": "00:00",
  "avgTimeAbandonDay": 0,
  "displayAvgTimeAbandonDay": "00:00",
  "avgTimeTalkDay": 0,
  "displayAvgTimeTalkDay": "00:00",
  "totalTimeAfterCallDay": 18000,
  "displayTotalTimeAfterCallDay": "300:00",
  "percentWithinServiceLevelDay": -1,
  "flowIn": 0,
  "flowOut": 0,
  "totalTimeAuxOther": 0,
  "displayTotalTimeAuxOther": "00:00",
  "avgStaff": 1,
  "agent": [
    {
      "agentName": "YP",
      "agentID": "19900",
      "extension": "10001",
      "state": "AUX",
      "reasoncode": "3",
      "time": "5:14",
      "duration": 206,
      "acdCalls": 0,
      "extInCalls": 0,
      "extOutCalls": 0,
      "acdCallsDay": 0,
      "avgTalkTimeDay": 0,
      "totalACWDay": 18000,
      "totalAvailableTimeDay": 0,
      "totalAuxOthersDay": 0,
      "extnCallsDay": 0,
      "avgExtnTimeDay": 0,
      "totalTimeStaffedDay": 18000,
      "totalHoldTimeDay": 0
    }
  ]
}

bcmsSVR 2.3.0 Released

Posted: May 7, 2024 in BCMS, News

bcmsSVR 2.3.0 just released, this version has the following updates.

1. Fixed the totalPercentWithinServiceLevelDay value as -1(undefined) when the service level is zero but with abandoned calls.
2. Support multiple instances of bcmsSVR on the same machine.
3. Add AUX0-AUX9 for bcmsmonitorsplitagentstats API
4. Merge the APIs bcmsmonitorsplitsla and bcmsmonitorsplitagentstats, the final one is bcmsmonitorsplitsla. No modification for API bcmsmonitorsplitagentstats in the futurer.
5. Add bcmslistsummaryagentday fields for each agent in the API bcmsmonitorsplitsla.
6. Modify bcmsmonitorsplitstatus to handle CTI integration similar to API bcmsmonitorsplitsla.
7. Add “setup”, “setup database”, “setup api” and “setup splunk” commands for program configuration.

bcmsSVR 2.2.1 Released

Posted: October 4, 2023 in BCMS, News

bcmsSVR 2.2.1 just released, this version has the following updates.

1. The bcmsmonitorsplitstatus has a summary of AUX0-AUX9 counts.
2. The API bcmsmonitorsplitagentstats was modified to include a consolidated agent list.
3. Fixed the bcmsmonitorsplitstatus duration zero when there was no integration with CTI.
4. Updates the bcms agent state to CMS agent state format when integration with CTI.

bcmsSVR 2.2.0 Released

Posted: March 29, 2023 in BCMS, News

bcmsSVR 2.2.0 just released, this version has the following updates.

1. Supports using SQLite as the configuration database. The deployment for Linux does not require MySQL database.
2. Supports 64-bit Windows binary.
3. Add splitName mapping in the displayagent API.
4. Implements database function for the API bcmsonitorsplitsla.
5. Add parameter bcms_sslmethod to indicate SSL method for RESTS API connection.
6. Add parameters bcms_sslmethodminversion and bcms_sslmethodmaxversion to control the SSL minimum and maximum version.
7. Add parameter tg_telnetbindip to bind the telnet port to a specific IP address. For example, 127.0.0.1
8. Supports multiline commands by the tcpgate console.

bcmsSVR 2.1.3 Released

Posted: October 11, 2021 in BCMS, News

bcmsSVR 2.1.3 just released, this version has the following updates.

1. Add bcmslistsummarysplitday, bcmslistsummaryvdnday, bcmslistsummaryagentday and bcmslistsummarytrunkday APIs and the data structures.
2. Add bcmsmonitorsplitsla API and its data structure.
3. Add bcmsmonitorsplitstatus API and its data structure.
4. Add bcmsmonitorsplitsla Prometheus metrics.

After integration with Prometheus, we can produce the Grafana dashboards and graphs by Prometheus.

GrafanaDashboards

bcmsSVR 2.1.2 Released

Posted: March 18, 2021 in BCMS, News

bcmsSVR 2.1.2 just released, this version has the following updates.

1. Supports Grafana and Prometheus integration by metrics REST API.
2. The bcmsmonitorsystem and bcmsmonitorvdn allow multiple objects that the input object length over 44 characters long.
3. The listtrunk, listhunt and listvdn REST API support filter options for Grafana integration.
4. The bcmsmonitorsystem, bcmsmonitorsplit, bcmsmonitorvdn and statustrunk supports mulitple object format that sent from Grafana.

After successfully integration of bcmsSVR with Grafana, we continue to enhance our products to support Prometheus integration by metrics API. Currently, the UPINGET tools clintSVR, bcmsSVR and AvayaMonitor produce the Prometheus metrics and you can easily create time series dashboards in Grafana. Here are some example. If you are interested to quickly create dashboards for you call centers with minimum cost, please contact us by email.

Grafana is a great analytics platform, we can use Open Source Grafana to monitor Avaya Call Center. We have several tools that can integrate with Avaya via the Avaya CM, AES and CMS interfaces to get real-time and history data. This post illustrates the step by step procedure to use Grafana and these tools to produce a lot of useful real time dashboards for Avaya call center. These dashboards including

  • Real-time Trunk Report – Incoming calls of a call center firstly hit the trunks of the call center. We can use bcmsSVR to monitor the real-time trunk status. The dashboard will show how many trunk members are idle, in used or in unknown status.
  • Real-time VDN Report – Individual incoming call then reached a VDN and a vector is executing to route the call. We can use bcmsSVR to monitor the real-time VDN status. The dashboard will show number of calls waiting, number of ACD calls handled, the average talk time, etc.
  • Real-time Queue Report – The call then routed to Queue and finally delivered to an agent. We can use bcmsSVR to monitor the real-time Queue status. The dashboard will show number of calls waiting, number of agent staffed and the number of agent in different ACD status, etc.
  • Real-time KPI Report – The KPI dashboard will show the KPI performance of an specific Queue, it contains data such as Calls Waiting, Oldest Calls Waiting, ACHT and Service Level, etc.
  • Real-time Call Queue Report – To identify which customer is waiting in the queue and showing the waiting time and position of the caller is critical to improve customer service. We can use CallAnalytics to get data such as the caller, VDN, and waiting time of all customers waiting in a specific VDN.
  • Real-time Call Answer Report – This report will show all the customers who is talking to the agents for a specific VDN. We can use CallAnalytics to get data such as caller, VDN and answering time of the calls.
  • Real-time Agent Report – A Queue is a logical unit for Automatic Call Distribution. There are numerous of agents login to ACD to handle the calls. We can use the bcmsSVR to monitor the real-time Queue status. The dashboard will show all agents in the Queue and their real-time status.
  • Intra-day VDN Report – We can use bcmsSVR to get interval (24 hours / 12 hours) report of a specific VDN.
  • Intra-day Queue Report – We can use bcmsSVR to get interval (24 hours / 12 hours) report of a specific Queue.

We have successfully integrated bcmsSVR and CallAnalytics with Grafana using JSON API developed by Marcus Olsson.  Please follow the procedure to install the API. 

First, we add the JSON API as data source for different bcmsSVR and CallAnalytics API. These API include

  • bcmsSVR statustrunk JSON API
  • bcmsSVR bcmsmonitorvdn JSON API
  • bcmsSVR bcmsmonitorsplit JSON API
  • bcmsSVR bcmsmonitorsystem JSON API
  • bcmsSVR bcmslistvdn JSON API
  • bcmsSVR bcmslistsplit JSON API
  • CallAnalytics callqueue JSON API
  • CallAnalytics callanswer JSON API

Second, we add the panels one by one and the screen dump of these panel configurations as follows

  • Trunk Panel
  • VDN Panel
  • Queue Panel
  • Call Queue Panel
  • Call Answer Panel
  • KPI Panel
  • Agent Panel
  • VDN Intra-day Panel
  • Queue Intra-day Panel

The final output of the dashboard by grouping the panels together

If you are interested the integration of Grafana with Avaya, you can contact us directly. Our contact is service@upinget.com. Have fun!

Splunk App CallAnalytics v1.0.1

Posted: January 31, 2021 in BCMS, News

Splunk App CallAnalytics v1.0.1 just released. It supports 

  • Queue Real-time Dashboard
  • VDN Real-time Dashboard
  • Agent Real-time Dashboard
  • Trunk Real-time Dashboard
  • Call Search 
  • Attendance Search 

You can find the new screen dumps as follows: